Cherokee vs Japanese Self-Care Disability
COMPARE
Cherokee
Japanese
Self-Care Disability
Self-Care Disability Comparison
Cherokee
Japanese
2.9%
SELF-CARE DISABILITY
0.0/ 100
METRIC RATING
324th/ 347
METRIC RANK
2.7%
SELF-CARE DISABILITY
0.1/ 100
METRIC RATING
276th/ 347
METRIC RANK
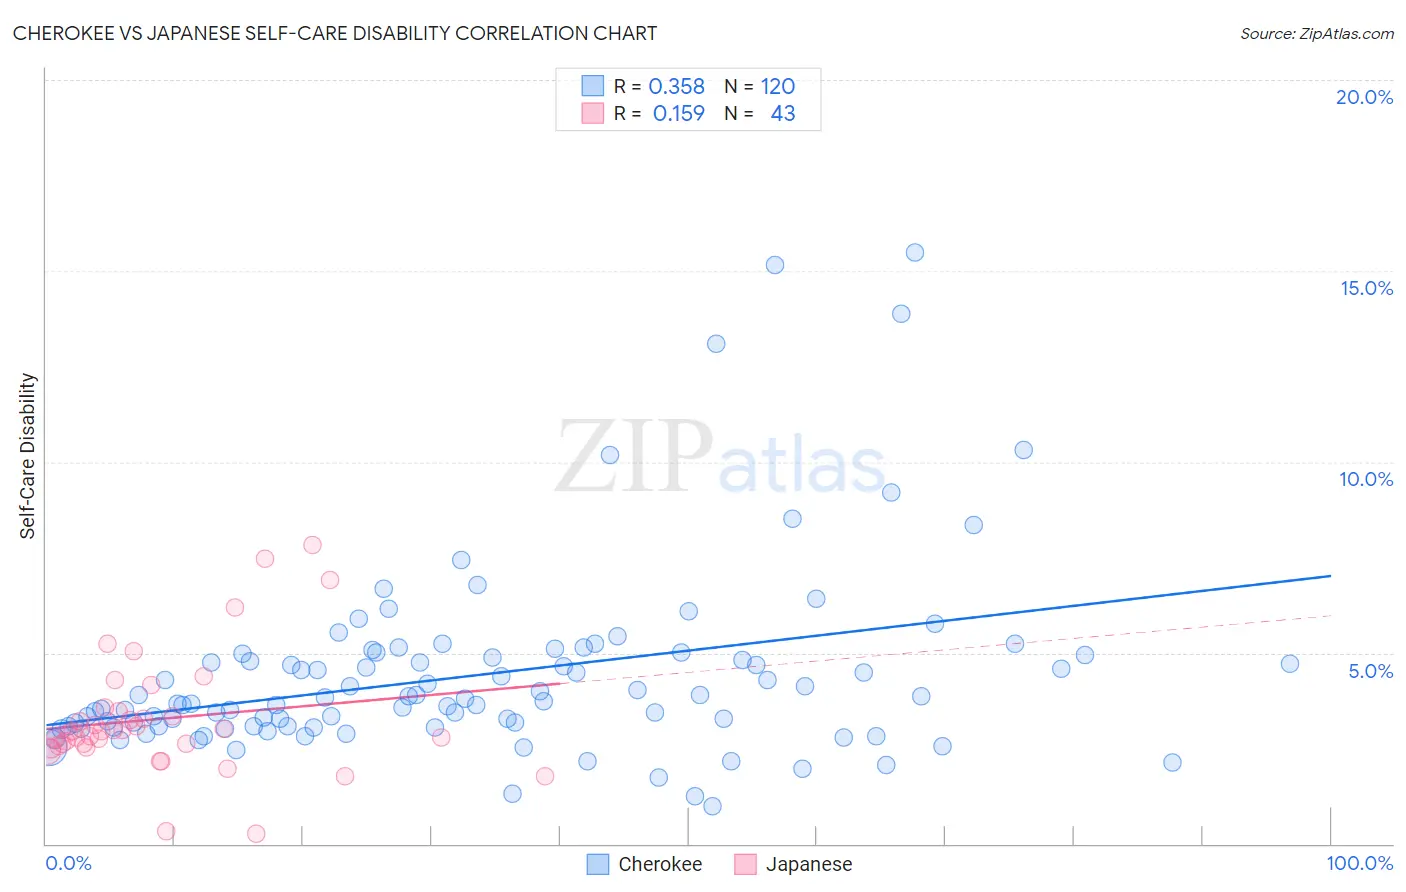
Cherokee vs Japanese Self-Care Disability Correlation Chart
The statistical analysis conducted on geographies consisting of 492,732,584 people shows a mild positive correlation between the proportion of Cherokee and percentage of population with self-care disability in the United States with a correlation coefficient (R) of 0.358 and weighted average of 2.9%. Similarly, the statistical analysis conducted on geographies consisting of 249,013,660 people shows a poor positive correlation between the proportion of Japanese and percentage of population with self-care disability in the United States with a correlation coefficient (R) of 0.159 and weighted average of 2.7%, a difference of 7.4%.
Self-Care Disability Correlation Summary
| Measurement | Cherokee | Japanese |
| Minimum | 0.97% | 0.26% |
| Maximum | 15.5% | 7.8% |
| Range | 14.5% | 7.6% |
| Mean | 4.4% | 3.3% |
| Median | 3.8% | 2.9% |
| Interquartile 25% (IQ1) | 3.1% | 2.6% |
| Interquartile 75% (IQ3) | 4.9% | 3.5% |
| Interquartile Range (IQR) | 1.8% | 0.91% |
| Standard Deviation (Sample) | 2.5% | 1.6% |
| Standard Deviation (Population) | 2.5% | 1.5% |
Similar Demographics by Self-Care Disability
Demographics Similar to Cherokee by Self-Care Disability
In terms of self-care disability, the demographic groups most similar to Cherokee are Seminole (2.9%, a difference of 0.10%), Comanche (2.9%, a difference of 0.22%), Immigrants from Uzbekistan (2.9%, a difference of 0.53%), Navajo (2.9%, a difference of 0.55%), and Chickasaw (2.9%, a difference of 0.70%).
| Demographics | Rating | Rank | Self-Care Disability |
| Immigrants | Dominica | 0.0 /100 | #317 | Tragic 2.8% |
| Assyrians/Chaldeans/Syriacs | 0.0 /100 | #318 | Tragic 2.8% |
| Spanish American Indians | 0.0 /100 | #319 | Tragic 2.9% |
| Chickasaw | 0.0 /100 | #320 | Tragic 2.9% |
| Navajo | 0.0 /100 | #321 | Tragic 2.9% |
| Comanche | 0.0 /100 | #322 | Tragic 2.9% |
| Seminole | 0.0 /100 | #323 | Tragic 2.9% |
| Cherokee | 0.0 /100 | #324 | Tragic 2.9% |
| Immigrants | Uzbekistan | 0.0 /100 | #325 | Tragic 2.9% |
| Paiute | 0.0 /100 | #326 | Tragic 2.9% |
| Blacks/African Americans | 0.0 /100 | #327 | Tragic 2.9% |
| Hopi | 0.0 /100 | #328 | Tragic 2.9% |
| Cajuns | 0.0 /100 | #329 | Tragic 2.9% |
| Nepalese | 0.0 /100 | #330 | Tragic 3.0% |
| Lumbee | 0.0 /100 | #331 | Tragic 3.0% |
Demographics Similar to Japanese by Self-Care Disability
In terms of self-care disability, the demographic groups most similar to Japanese are Immigrants from Ukraine (2.7%, a difference of 0.060%), Yakama (2.7%, a difference of 0.13%), Immigrants from Trinidad and Tobago (2.7%, a difference of 0.13%), Ottawa (2.7%, a difference of 0.14%), and Mexican (2.7%, a difference of 0.19%).
| Demographics | Rating | Rank | Self-Care Disability |
| U.S. Virgin Islanders | 0.1 /100 | #269 | Tragic 2.7% |
| Immigrants | Micronesia | 0.1 /100 | #270 | Tragic 2.7% |
| Trinidadians and Tobagonians | 0.1 /100 | #271 | Tragic 2.7% |
| Immigrants | Laos | 0.1 /100 | #272 | Tragic 2.7% |
| Mexicans | 0.1 /100 | #273 | Tragic 2.7% |
| Yakama | 0.1 /100 | #274 | Tragic 2.7% |
| Immigrants | Trinidad and Tobago | 0.1 /100 | #275 | Tragic 2.7% |
| Japanese | 0.1 /100 | #276 | Tragic 2.7% |
| Immigrants | Ukraine | 0.1 /100 | #277 | Tragic 2.7% |
| Ottawa | 0.1 /100 | #278 | Tragic 2.7% |
| Iroquois | 0.1 /100 | #279 | Tragic 2.7% |
| Hispanics or Latinos | 0.1 /100 | #280 | Tragic 2.7% |
| Immigrants | Iraq | 0.0 /100 | #281 | Tragic 2.7% |
| Apache | 0.0 /100 | #282 | Tragic 2.7% |
| Delaware | 0.0 /100 | #283 | Tragic 2.7% |