Central American vs Immigrants from Zaire 4th Grade
COMPARE
Central American
Immigrants from Zaire
4th Grade
4th Grade Comparison
Central Americans
Immigrants from Zaire
95.5%
4TH GRADE
0.0/ 100
METRIC RATING
337th/ 347
METRIC RANK
97.3%
4TH GRADE
12.8/ 100
METRIC RATING
206th/ 347
METRIC RANK
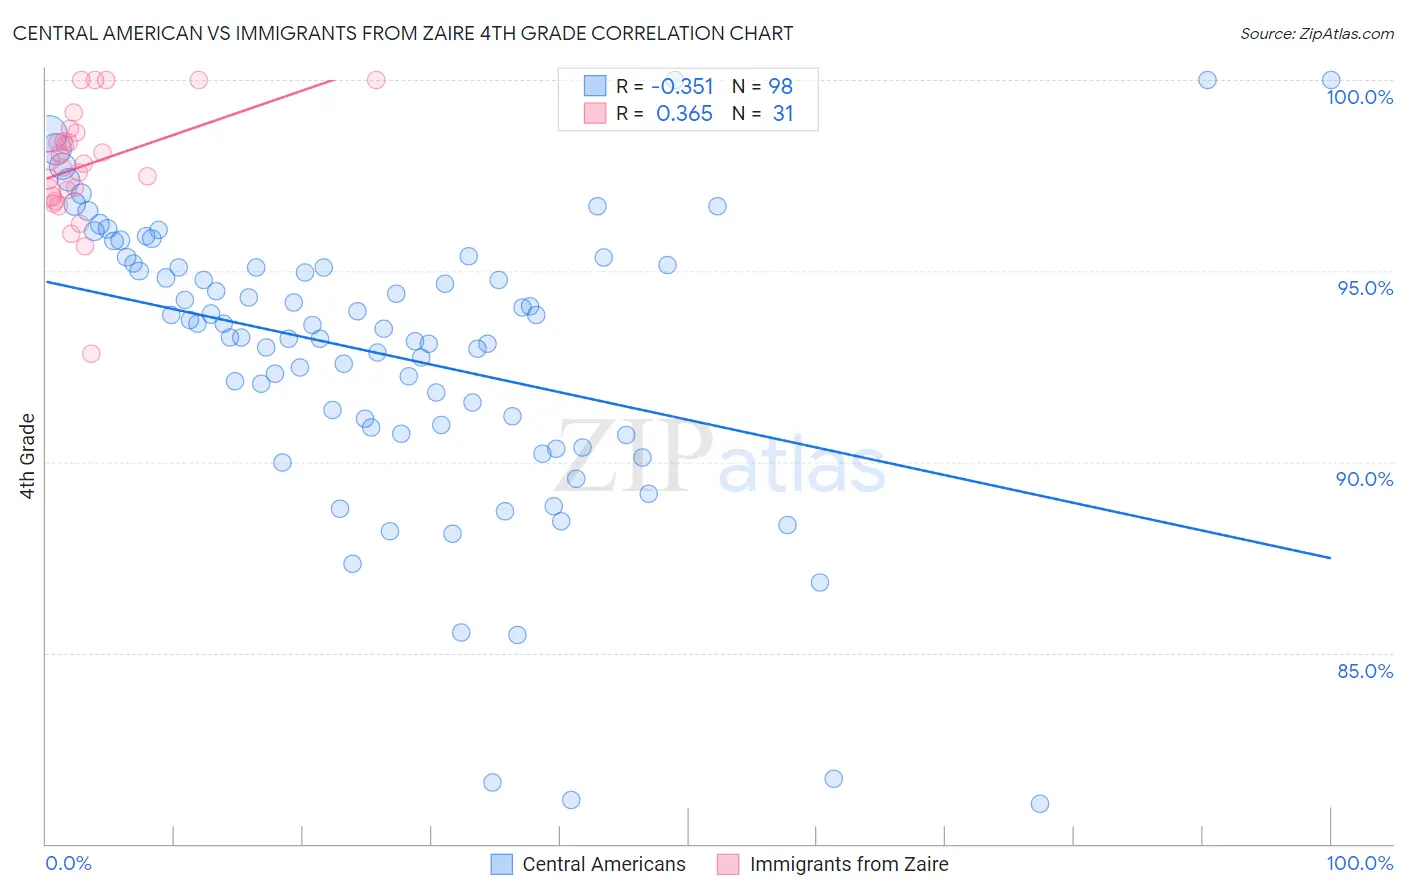
Central American vs Immigrants from Zaire 4th Grade Correlation Chart
The statistical analysis conducted on geographies consisting of 504,618,163 people shows a mild negative correlation between the proportion of Central Americans and percentage of population with at least 4th grade education in the United States with a correlation coefficient (R) of -0.351 and weighted average of 95.5%. Similarly, the statistical analysis conducted on geographies consisting of 107,212,695 people shows a mild positive correlation between the proportion of Immigrants from Zaire and percentage of population with at least 4th grade education in the United States with a correlation coefficient (R) of 0.365 and weighted average of 97.3%, a difference of 1.9%.
4th Grade Correlation Summary
| Measurement | Central American | Immigrants from Zaire |
| Minimum | 81.0% | 92.8% |
| Maximum | 100.0% | 100.0% |
| Range | 19.0% | 7.2% |
| Mean | 92.8% | 97.8% |
| Median | 93.5% | 97.8% |
| Interquartile 25% (IQ1) | 90.9% | 96.9% |
| Interquartile 75% (IQ3) | 95.2% | 98.6% |
| Interquartile Range (IQR) | 4.3% | 1.7% |
| Standard Deviation (Sample) | 3.8% | 1.5% |
| Standard Deviation (Population) | 3.8% | 1.5% |
Similar Demographics by 4th Grade
Demographics Similar to Central Americans by 4th Grade
In terms of 4th grade, the demographic groups most similar to Central Americans are Nepalese (95.5%, a difference of 0.0%), Mexican (95.6%, a difference of 0.13%), Immigrants from Latin America (95.7%, a difference of 0.19%), Guatemalan (95.3%, a difference of 0.20%), and Immigrants from Dominican Republic (95.7%, a difference of 0.26%).
| Demographics | Rating | Rank | 4th Grade |
| Immigrants | Fiji | 0.0 /100 | #330 | Tragic 95.8% |
| Immigrants | Armenia | 0.0 /100 | #331 | Tragic 95.8% |
| Immigrants | Honduras | 0.0 /100 | #332 | Tragic 95.8% |
| Immigrants | Dominican Republic | 0.0 /100 | #333 | Tragic 95.7% |
| Immigrants | Cabo Verde | 0.0 /100 | #334 | Tragic 95.7% |
| Immigrants | Latin America | 0.0 /100 | #335 | Tragic 95.7% |
| Mexicans | 0.0 /100 | #336 | Tragic 95.6% |
| Central Americans | 0.0 /100 | #337 | Tragic 95.5% |
| Nepalese | 0.0 /100 | #338 | Tragic 95.5% |
| Guatemalans | 0.0 /100 | #339 | Tragic 95.3% |
| Yakama | 0.0 /100 | #340 | Tragic 95.2% |
| Immigrants | Yemen | 0.0 /100 | #341 | Tragic 95.2% |
| Immigrants | Central America | 0.0 /100 | #342 | Tragic 95.1% |
| Immigrants | Guatemala | 0.0 /100 | #343 | Tragic 95.1% |
| Immigrants | Mexico | 0.0 /100 | #344 | Tragic 95.1% |
Demographics Similar to Immigrants from Zaire by 4th Grade
In terms of 4th grade, the demographic groups most similar to Immigrants from Zaire are Paiute (97.3%, a difference of 0.0%), African (97.4%, a difference of 0.010%), Moroccan (97.3%, a difference of 0.010%), Immigrants from Northern Africa (97.4%, a difference of 0.020%), and Immigrants from Bahamas (97.3%, a difference of 0.020%).
| Demographics | Rating | Rank | 4th Grade |
| Natives/Alaskans | 20.6 /100 | #199 | Fair 97.4% |
| Immigrants | Uganda | 19.8 /100 | #200 | Poor 97.4% |
| Immigrants | Southern Europe | 16.2 /100 | #201 | Poor 97.4% |
| Immigrants | Chile | 16.1 /100 | #202 | Poor 97.4% |
| Immigrants | Northern Africa | 15.1 /100 | #203 | Poor 97.4% |
| Africans | 14.6 /100 | #204 | Poor 97.4% |
| Paiute | 13.2 /100 | #205 | Poor 97.3% |
| Immigrants | Zaire | 12.8 /100 | #206 | Poor 97.3% |
| Moroccans | 11.3 /100 | #207 | Poor 97.3% |
| Immigrants | Bahamas | 10.8 /100 | #208 | Poor 97.3% |
| Laotians | 9.3 /100 | #209 | Tragic 97.3% |
| Immigrants | Oceania | 9.1 /100 | #210 | Tragic 97.3% |
| Sudanese | 9.0 /100 | #211 | Tragic 97.3% |
| Tohono O'odham | 8.4 /100 | #212 | Tragic 97.3% |
| Costa Ricans | 8.3 /100 | #213 | Tragic 97.3% |