Somali vs Immigrants from the Azores 4th Grade
COMPARE
Somali
Immigrants from the Azores
4th Grade
4th Grade Comparison
Somalis
Immigrants from the Azores
96.6%
4TH GRADE
0.0/ 100
METRIC RATING
296th/ 347
METRIC RANK
96.1%
4TH GRADE
0.0/ 100
METRIC RATING
318th/ 347
METRIC RANK
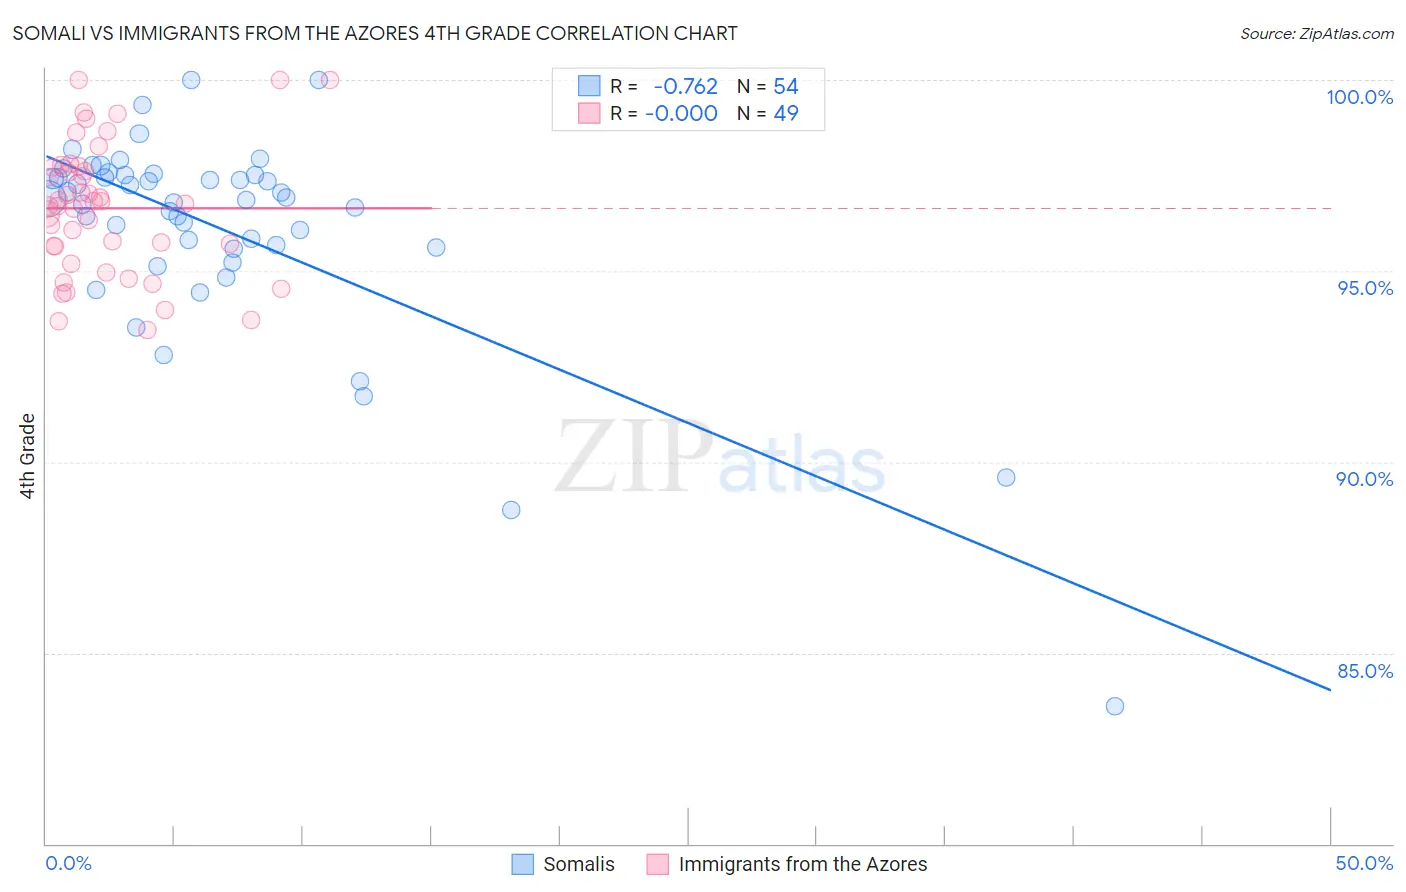
Somali vs Immigrants from the Azores 4th Grade Correlation Chart
The statistical analysis conducted on geographies consisting of 99,332,457 people shows a strong negative correlation between the proportion of Somalis and percentage of population with at least 4th grade education in the United States with a correlation coefficient (R) of -0.762 and weighted average of 96.6%. Similarly, the statistical analysis conducted on geographies consisting of 46,257,310 people shows no correlation between the proportion of Immigrants from the Azores and percentage of population with at least 4th grade education in the United States with a correlation coefficient (R) of -0.000 and weighted average of 96.1%, a difference of 0.52%.
4th Grade Correlation Summary
| Measurement | Somali | Immigrants from the Azores |
| Minimum | 83.6% | 93.4% |
| Maximum | 100.0% | 100.0% |
| Range | 16.4% | 6.6% |
| Mean | 96.1% | 96.6% |
| Median | 96.9% | 96.8% |
| Interquartile 25% (IQ1) | 95.6% | 95.4% |
| Interquartile 75% (IQ3) | 97.5% | 97.7% |
| Interquartile Range (IQR) | 1.9% | 2.3% |
| Standard Deviation (Sample) | 2.8% | 1.7% |
| Standard Deviation (Population) | 2.8% | 1.7% |
Similar Demographics by 4th Grade
Demographics Similar to Somalis by 4th Grade
In terms of 4th grade, the demographic groups most similar to Somalis are Immigrants from Portugal (96.6%, a difference of 0.010%), Immigrants from Eritrea (96.7%, a difference of 0.030%), Puerto Rican (96.7%, a difference of 0.050%), Malaysian (96.7%, a difference of 0.070%), and Immigrants from Grenada (96.7%, a difference of 0.080%).
| Demographics | Rating | Rank | 4th Grade |
| Immigrants | West Indies | 0.0 /100 | #289 | Tragic 96.7% |
| British West Indians | 0.0 /100 | #290 | Tragic 96.7% |
| Immigrants | Grenada | 0.0 /100 | #291 | Tragic 96.7% |
| Malaysians | 0.0 /100 | #292 | Tragic 96.7% |
| Puerto Ricans | 0.0 /100 | #293 | Tragic 96.7% |
| Immigrants | Eritrea | 0.0 /100 | #294 | Tragic 96.7% |
| Immigrants | Portugal | 0.0 /100 | #295 | Tragic 96.6% |
| Somalis | 0.0 /100 | #296 | Tragic 96.6% |
| Immigrants | Somalia | 0.0 /100 | #297 | Tragic 96.5% |
| Haitians | 0.0 /100 | #298 | Tragic 96.5% |
| Immigrants | Dominica | 0.0 /100 | #299 | Tragic 96.5% |
| Immigrants | South Eastern Asia | 0.0 /100 | #300 | Tragic 96.5% |
| Immigrants | Immigrants | 0.0 /100 | #301 | Tragic 96.5% |
| Immigrants | Cuba | 0.0 /100 | #302 | Tragic 96.4% |
| Guyanese | 0.0 /100 | #303 | Tragic 96.4% |
Demographics Similar to Immigrants from the Azores by 4th Grade
In terms of 4th grade, the demographic groups most similar to Immigrants from the Azores are Belizean (96.1%, a difference of 0.020%), Central American Indian (96.2%, a difference of 0.040%), Bangladeshi (96.1%, a difference of 0.040%), Immigrants from Ecuador (96.2%, a difference of 0.080%), and Vietnamese (96.2%, a difference of 0.090%).
| Demographics | Rating | Rank | 4th Grade |
| Immigrants | Bangladesh | 0.0 /100 | #311 | Tragic 96.2% |
| Cape Verdeans | 0.0 /100 | #312 | Tragic 96.2% |
| Indonesians | 0.0 /100 | #313 | Tragic 96.2% |
| Vietnamese | 0.0 /100 | #314 | Tragic 96.2% |
| Nicaraguans | 0.0 /100 | #315 | Tragic 96.2% |
| Immigrants | Ecuador | 0.0 /100 | #316 | Tragic 96.2% |
| Central American Indians | 0.0 /100 | #317 | Tragic 96.2% |
| Immigrants | Azores | 0.0 /100 | #318 | Tragic 96.1% |
| Belizeans | 0.0 /100 | #319 | Tragic 96.1% |
| Bangladeshis | 0.0 /100 | #320 | Tragic 96.1% |
| Japanese | 0.0 /100 | #321 | Tragic 96.0% |
| Immigrants | Vietnam | 0.0 /100 | #322 | Tragic 96.0% |
| Immigrants | Nicaragua | 0.0 /100 | #323 | Tragic 96.0% |
| Immigrants | Belize | 0.0 /100 | #324 | Tragic 96.0% |
| Dominicans | 0.0 /100 | #325 | Tragic 96.0% |