Central American vs Immigrants from Norway 4th Grade
COMPARE
Central American
Immigrants from Norway
4th Grade
4th Grade Comparison
Central Americans
Immigrants from Norway
95.5%
4TH GRADE
0.0/ 100
METRIC RATING
337th/ 347
METRIC RANK
97.8%
4TH GRADE
94.2/ 100
METRIC RATING
121st/ 347
METRIC RANK
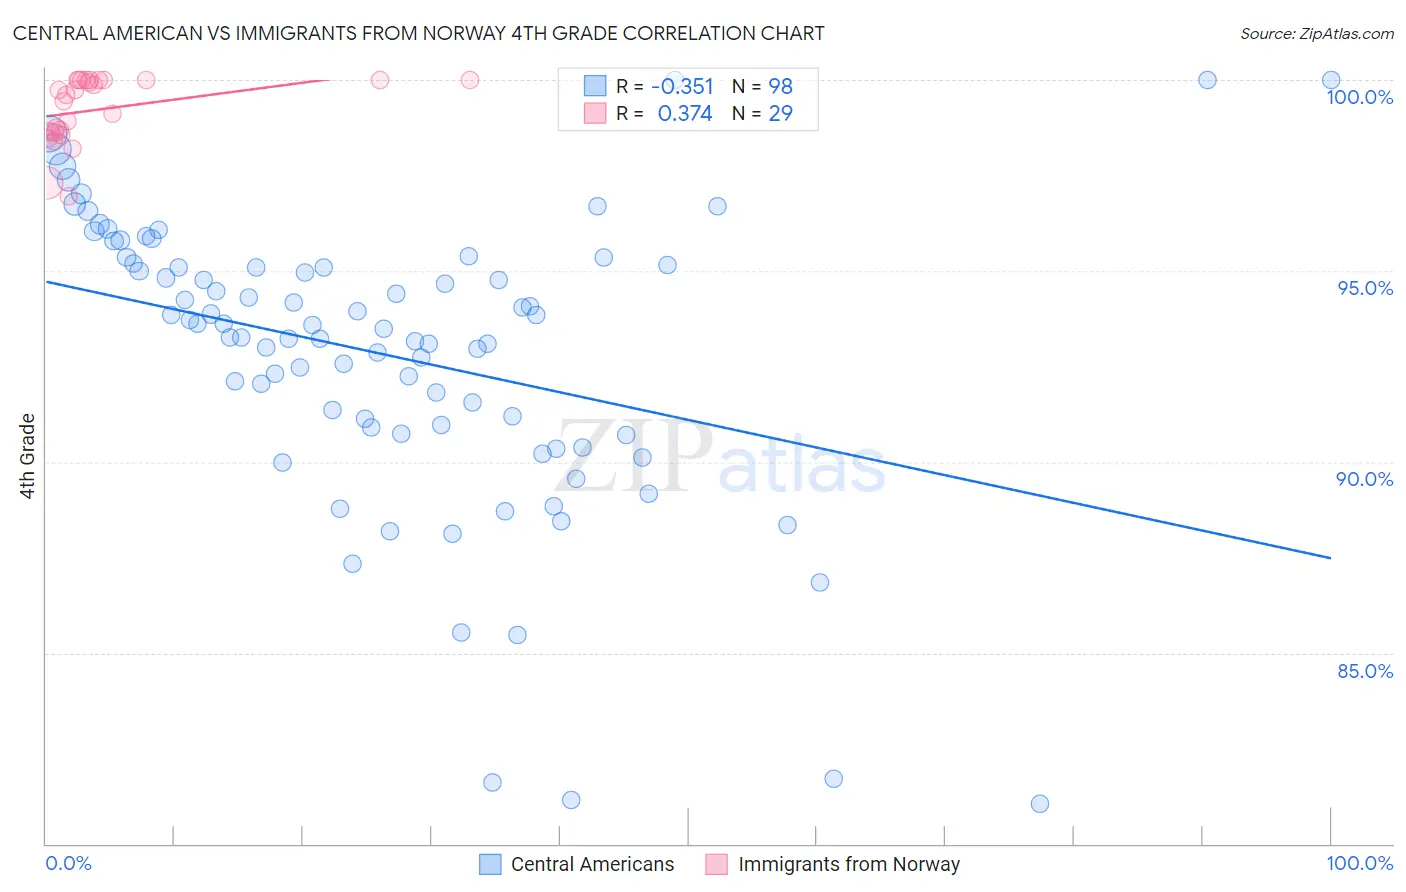
Central American vs Immigrants from Norway 4th Grade Correlation Chart
The statistical analysis conducted on geographies consisting of 504,618,163 people shows a mild negative correlation between the proportion of Central Americans and percentage of population with at least 4th grade education in the United States with a correlation coefficient (R) of -0.351 and weighted average of 95.5%. Similarly, the statistical analysis conducted on geographies consisting of 116,716,420 people shows a mild positive correlation between the proportion of Immigrants from Norway and percentage of population with at least 4th grade education in the United States with a correlation coefficient (R) of 0.374 and weighted average of 97.8%, a difference of 2.4%.
4th Grade Correlation Summary
| Measurement | Central American | Immigrants from Norway |
| Minimum | 81.0% | 97.0% |
| Maximum | 100.0% | 100.0% |
| Range | 19.0% | 3.0% |
| Mean | 92.8% | 99.2% |
| Median | 93.5% | 99.6% |
| Interquartile 25% (IQ1) | 90.9% | 98.6% |
| Interquartile 75% (IQ3) | 95.2% | 100.0% |
| Interquartile Range (IQR) | 4.3% | 1.4% |
| Standard Deviation (Sample) | 3.8% | 0.86% |
| Standard Deviation (Population) | 3.8% | 0.85% |
Similar Demographics by 4th Grade
Demographics Similar to Central Americans by 4th Grade
In terms of 4th grade, the demographic groups most similar to Central Americans are Nepalese (95.5%, a difference of 0.0%), Mexican (95.6%, a difference of 0.13%), Immigrants from Latin America (95.7%, a difference of 0.19%), Guatemalan (95.3%, a difference of 0.20%), and Immigrants from Dominican Republic (95.7%, a difference of 0.26%).
| Demographics | Rating | Rank | 4th Grade |
| Immigrants | Fiji | 0.0 /100 | #330 | Tragic 95.8% |
| Immigrants | Armenia | 0.0 /100 | #331 | Tragic 95.8% |
| Immigrants | Honduras | 0.0 /100 | #332 | Tragic 95.8% |
| Immigrants | Dominican Republic | 0.0 /100 | #333 | Tragic 95.7% |
| Immigrants | Cabo Verde | 0.0 /100 | #334 | Tragic 95.7% |
| Immigrants | Latin America | 0.0 /100 | #335 | Tragic 95.7% |
| Mexicans | 0.0 /100 | #336 | Tragic 95.6% |
| Central Americans | 0.0 /100 | #337 | Tragic 95.5% |
| Nepalese | 0.0 /100 | #338 | Tragic 95.5% |
| Guatemalans | 0.0 /100 | #339 | Tragic 95.3% |
| Yakama | 0.0 /100 | #340 | Tragic 95.2% |
| Immigrants | Yemen | 0.0 /100 | #341 | Tragic 95.2% |
| Immigrants | Central America | 0.0 /100 | #342 | Tragic 95.1% |
| Immigrants | Guatemala | 0.0 /100 | #343 | Tragic 95.1% |
| Immigrants | Mexico | 0.0 /100 | #344 | Tragic 95.1% |
Demographics Similar to Immigrants from Norway by 4th Grade
In terms of 4th grade, the demographic groups most similar to Immigrants from Norway are Immigrants from Japan (97.8%, a difference of 0.0%), Immigrants from Zimbabwe (97.8%, a difference of 0.0%), Syrian (97.8%, a difference of 0.010%), Menominee (97.8%, a difference of 0.010%), and Immigrants from Saudi Arabia (97.8%, a difference of 0.010%).
| Demographics | Rating | Rank | 4th Grade |
| Iroquois | 95.4 /100 | #114 | Exceptional 97.8% |
| Lebanese | 95.4 /100 | #115 | Exceptional 97.8% |
| Immigrants | Croatia | 95.2 /100 | #116 | Exceptional 97.8% |
| Syrians | 94.9 /100 | #117 | Exceptional 97.8% |
| Menominee | 94.9 /100 | #118 | Exceptional 97.8% |
| Immigrants | Saudi Arabia | 94.8 /100 | #119 | Exceptional 97.8% |
| Immigrants | France | 94.8 /100 | #120 | Exceptional 97.8% |
| Immigrants | Norway | 94.2 /100 | #121 | Exceptional 97.8% |
| Immigrants | Japan | 94.1 /100 | #122 | Exceptional 97.8% |
| Immigrants | Zimbabwe | 93.9 /100 | #123 | Exceptional 97.8% |
| Spanish | 93.7 /100 | #124 | Exceptional 97.8% |
| Immigrants | Serbia | 92.6 /100 | #125 | Exceptional 97.8% |
| Immigrants | Europe | 92.5 /100 | #126 | Exceptional 97.8% |
| Colville | 92.3 /100 | #127 | Exceptional 97.7% |
| Pima | 92.0 /100 | #128 | Exceptional 97.7% |