Central American vs U.S. Virgin Islander 4th Grade
COMPARE
Central American
U.S. Virgin Islander
4th Grade
4th Grade Comparison
Central Americans
U.S. Virgin Islanders
95.5%
4TH GRADE
0.0/ 100
METRIC RATING
337th/ 347
METRIC RANK
97.1%
4TH GRADE
1.4/ 100
METRIC RATING
243rd/ 347
METRIC RANK
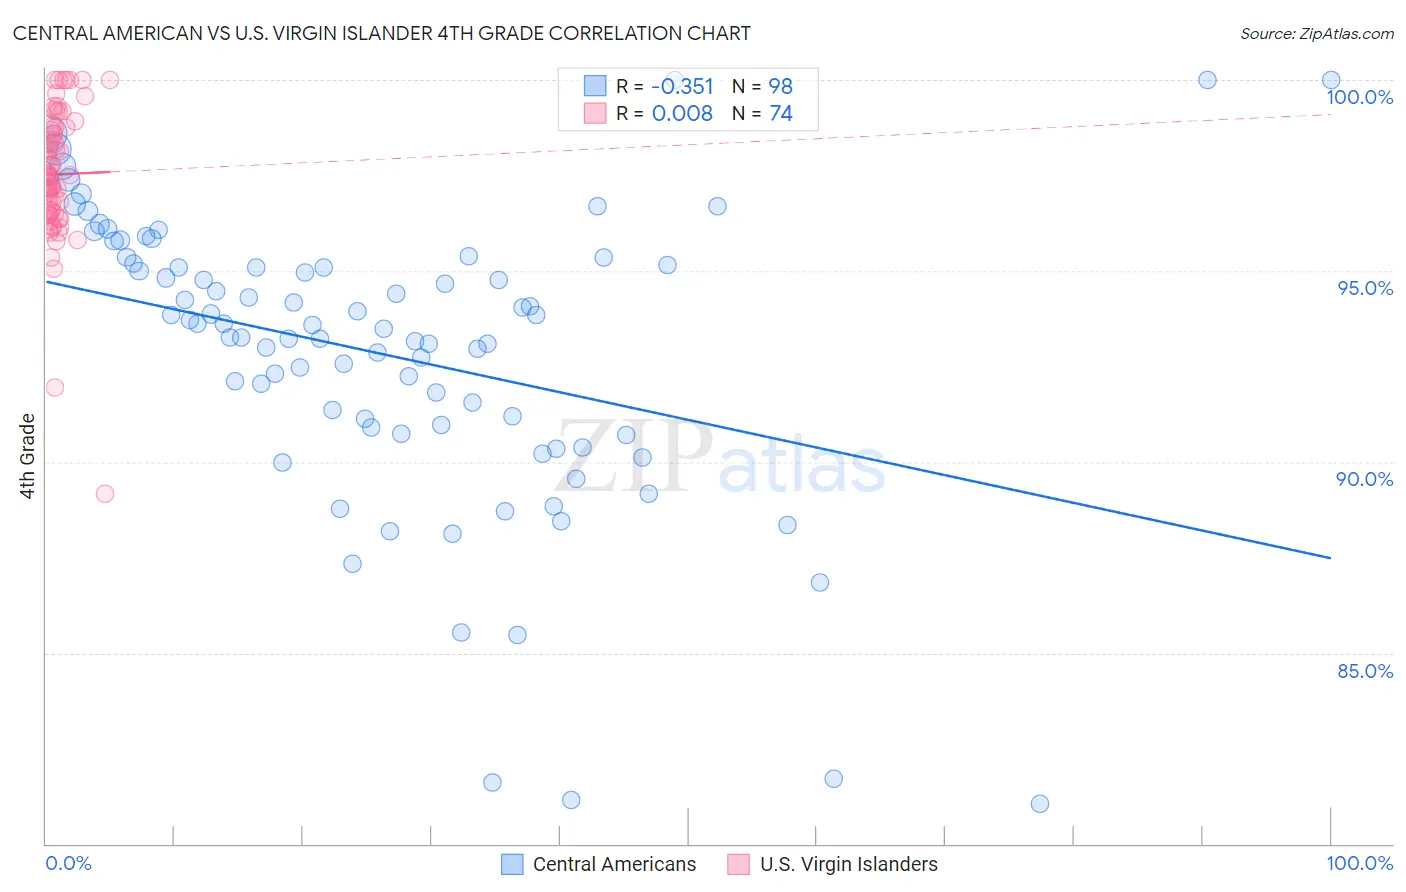
Central American vs U.S. Virgin Islander 4th Grade Correlation Chart
The statistical analysis conducted on geographies consisting of 504,618,163 people shows a mild negative correlation between the proportion of Central Americans and percentage of population with at least 4th grade education in the United States with a correlation coefficient (R) of -0.351 and weighted average of 95.5%. Similarly, the statistical analysis conducted on geographies consisting of 87,529,315 people shows no correlation between the proportion of U.S. Virgin Islanders and percentage of population with at least 4th grade education in the United States with a correlation coefficient (R) of 0.008 and weighted average of 97.1%, a difference of 1.7%.
4th Grade Correlation Summary
| Measurement | Central American | U.S. Virgin Islander |
| Minimum | 81.0% | 89.2% |
| Maximum | 100.0% | 100.0% |
| Range | 19.0% | 10.8% |
| Mean | 92.8% | 97.5% |
| Median | 93.5% | 97.5% |
| Interquartile 25% (IQ1) | 90.9% | 96.5% |
| Interquartile 75% (IQ3) | 95.2% | 98.7% |
| Interquartile Range (IQR) | 4.3% | 2.2% |
| Standard Deviation (Sample) | 3.8% | 1.8% |
| Standard Deviation (Population) | 3.8% | 1.8% |
Similar Demographics by 4th Grade
Demographics Similar to Central Americans by 4th Grade
In terms of 4th grade, the demographic groups most similar to Central Americans are Nepalese (95.5%, a difference of 0.0%), Mexican (95.6%, a difference of 0.13%), Immigrants from Latin America (95.7%, a difference of 0.19%), Guatemalan (95.3%, a difference of 0.20%), and Immigrants from Dominican Republic (95.7%, a difference of 0.26%).
| Demographics | Rating | Rank | 4th Grade |
| Immigrants | Fiji | 0.0 /100 | #330 | Tragic 95.8% |
| Immigrants | Armenia | 0.0 /100 | #331 | Tragic 95.8% |
| Immigrants | Honduras | 0.0 /100 | #332 | Tragic 95.8% |
| Immigrants | Dominican Republic | 0.0 /100 | #333 | Tragic 95.7% |
| Immigrants | Cabo Verde | 0.0 /100 | #334 | Tragic 95.7% |
| Immigrants | Latin America | 0.0 /100 | #335 | Tragic 95.7% |
| Mexicans | 0.0 /100 | #336 | Tragic 95.6% |
| Central Americans | 0.0 /100 | #337 | Tragic 95.5% |
| Nepalese | 0.0 /100 | #338 | Tragic 95.5% |
| Guatemalans | 0.0 /100 | #339 | Tragic 95.3% |
| Yakama | 0.0 /100 | #340 | Tragic 95.2% |
| Immigrants | Yemen | 0.0 /100 | #341 | Tragic 95.2% |
| Immigrants | Central America | 0.0 /100 | #342 | Tragic 95.1% |
| Immigrants | Guatemala | 0.0 /100 | #343 | Tragic 95.1% |
| Immigrants | Mexico | 0.0 /100 | #344 | Tragic 95.1% |
Demographics Similar to U.S. Virgin Islanders by 4th Grade
In terms of 4th grade, the demographic groups most similar to U.S. Virgin Islanders are Asian (97.1%, a difference of 0.0%), Immigrants from Indonesia (97.1%, a difference of 0.010%), Korean (97.1%, a difference of 0.010%), Immigrants from Eastern Africa (97.1%, a difference of 0.010%), and Immigrants from Uruguay (97.1%, a difference of 0.010%).
| Demographics | Rating | Rank | 4th Grade |
| Immigrants | Eastern Asia | 2.7 /100 | #236 | Tragic 97.2% |
| Immigrants | Costa Rica | 2.0 /100 | #237 | Tragic 97.2% |
| Indians (Asian) | 1.9 /100 | #238 | Tragic 97.2% |
| Nigerians | 1.8 /100 | #239 | Tragic 97.1% |
| Colombians | 1.6 /100 | #240 | Tragic 97.1% |
| Immigrants | Indonesia | 1.5 /100 | #241 | Tragic 97.1% |
| Asians | 1.4 /100 | #242 | Tragic 97.1% |
| U.S. Virgin Islanders | 1.4 /100 | #243 | Tragic 97.1% |
| Koreans | 1.3 /100 | #244 | Tragic 97.1% |
| Immigrants | Eastern Africa | 1.2 /100 | #245 | Tragic 97.1% |
| Immigrants | Uruguay | 1.2 /100 | #246 | Tragic 97.1% |
| Ethiopians | 1.2 /100 | #247 | Tragic 97.1% |
| Immigrants | Asia | 1.2 /100 | #248 | Tragic 97.1% |
| Immigrants | Africa | 1.0 /100 | #249 | Tragic 97.1% |
| Immigrants | Senegal | 0.9 /100 | #250 | Tragic 97.1% |