Central American Indian vs Soviet Union 6th Grade
COMPARE
Central American Indian
Soviet Union
6th Grade
6th Grade Comparison
Central American Indians
Soviet Union
95.1%
6TH GRADE
0.0/ 100
METRIC RATING
323rd/ 347
METRIC RANK
97.2%
6TH GRADE
71.5/ 100
METRIC RATING
154th/ 347
METRIC RANK
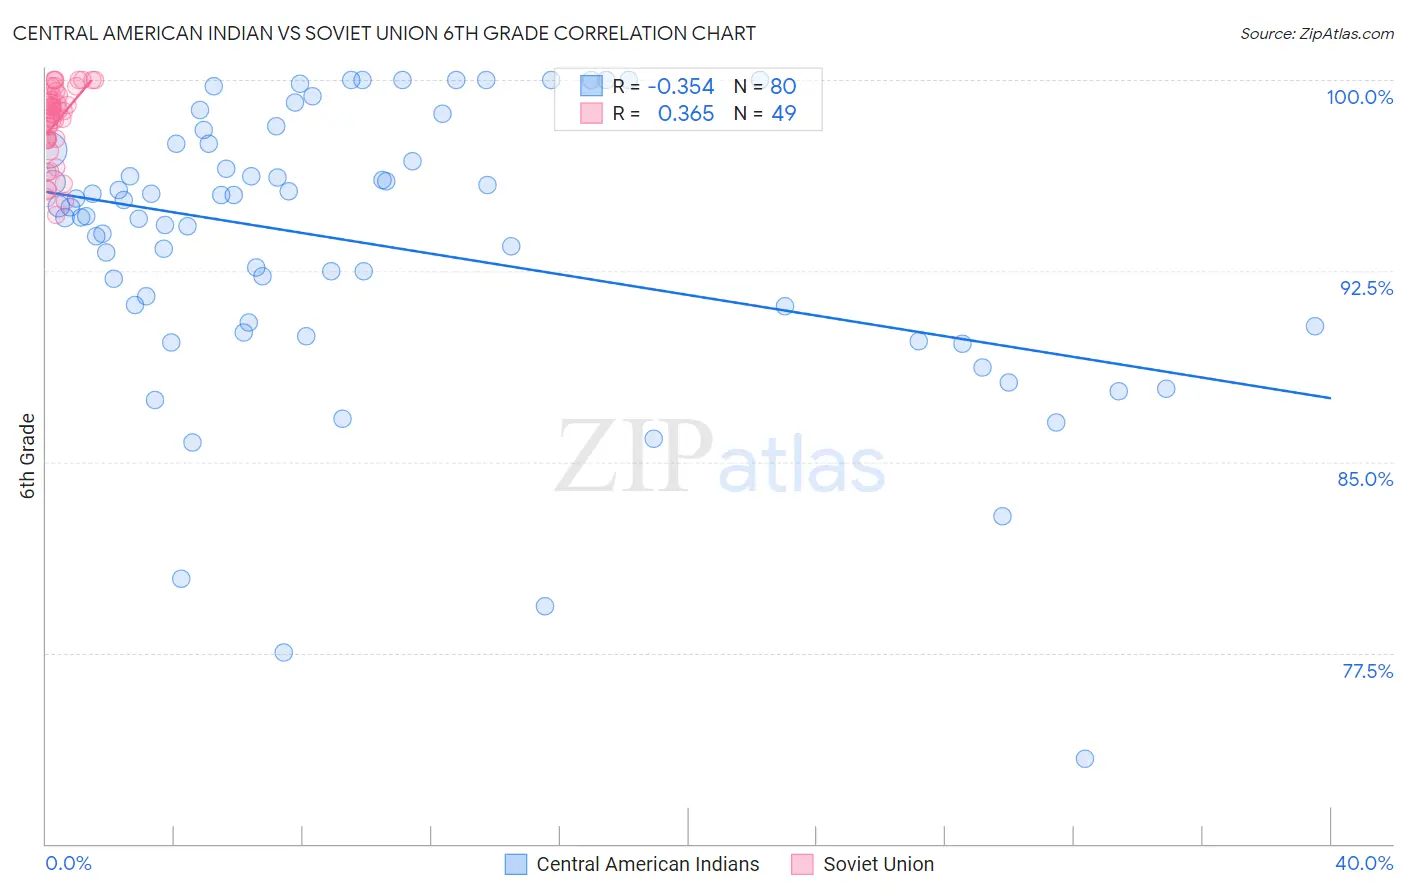
Central American Indian vs Soviet Union 6th Grade Correlation Chart
The statistical analysis conducted on geographies consisting of 326,143,005 people shows a mild negative correlation between the proportion of Central American Indians and percentage of population with at least 6th grade education in the United States with a correlation coefficient (R) of -0.354 and weighted average of 95.1%. Similarly, the statistical analysis conducted on geographies consisting of 43,454,395 people shows a mild positive correlation between the proportion of Soviet Union and percentage of population with at least 6th grade education in the United States with a correlation coefficient (R) of 0.365 and weighted average of 97.2%, a difference of 2.1%.
6th Grade Correlation Summary
| Measurement | Central American Indian | Soviet Union |
| Minimum | 73.4% | 94.7% |
| Maximum | 100.0% | 100.0% |
| Range | 26.6% | 5.3% |
| Mean | 93.5% | 98.3% |
| Median | 94.8% | 98.8% |
| Interquartile 25% (IQ1) | 90.4% | 97.7% |
| Interquartile 75% (IQ3) | 97.4% | 99.4% |
| Interquartile Range (IQR) | 7.0% | 1.7% |
| Standard Deviation (Sample) | 5.6% | 1.4% |
| Standard Deviation (Population) | 5.5% | 1.4% |
Similar Demographics by 6th Grade
Demographics Similar to Central American Indians by 6th Grade
In terms of 6th grade, the demographic groups most similar to Central American Indians are Immigrants from Cambodia (95.2%, a difference of 0.010%), Cape Verdean (95.1%, a difference of 0.030%), Immigrants from Fiji (95.2%, a difference of 0.060%), Immigrants from Nicaragua (95.1%, a difference of 0.060%), and Immigrants from Ecuador (95.3%, a difference of 0.13%).
| Demographics | Rating | Rank | 6th Grade |
| Japanese | 0.0 /100 | #316 | Tragic 95.4% |
| Vietnamese | 0.0 /100 | #317 | Tragic 95.3% |
| Belizeans | 0.0 /100 | #318 | Tragic 95.3% |
| Immigrants | Belize | 0.0 /100 | #319 | Tragic 95.3% |
| Immigrants | Ecuador | 0.0 /100 | #320 | Tragic 95.3% |
| Immigrants | Fiji | 0.0 /100 | #321 | Tragic 95.2% |
| Immigrants | Cambodia | 0.0 /100 | #322 | Tragic 95.2% |
| Central American Indians | 0.0 /100 | #323 | Tragic 95.1% |
| Cape Verdeans | 0.0 /100 | #324 | Tragic 95.1% |
| Immigrants | Nicaragua | 0.0 /100 | #325 | Tragic 95.1% |
| Hispanics or Latinos | 0.0 /100 | #326 | Tragic 95.0% |
| Mexican American Indians | 0.0 /100 | #327 | Tragic 95.0% |
| Hondurans | 0.0 /100 | #328 | Tragic 95.0% |
| Dominicans | 0.0 /100 | #329 | Tragic 94.9% |
| Nepalese | 0.0 /100 | #330 | Tragic 94.9% |
Demographics Similar to Soviet Union by 6th Grade
In terms of 6th grade, the demographic groups most similar to Soviet Union are Ute (97.1%, a difference of 0.0%), French American Indian (97.2%, a difference of 0.010%), Immigrants from Jordan (97.2%, a difference of 0.010%), Immigrants from Eastern Europe (97.2%, a difference of 0.010%), and Alsatian (97.1%, a difference of 0.010%).
| Demographics | Rating | Rank | 6th Grade |
| Immigrants | South Central Asia | 78.1 /100 | #147 | Good 97.2% |
| Immigrants | Greece | 77.8 /100 | #148 | Good 97.2% |
| Immigrants | Israel | 76.0 /100 | #149 | Good 97.2% |
| Immigrants | Bosnia and Herzegovina | 74.8 /100 | #150 | Good 97.2% |
| French American Indians | 74.0 /100 | #151 | Good 97.2% |
| Immigrants | Jordan | 73.0 /100 | #152 | Good 97.2% |
| Immigrants | Eastern Europe | 72.6 /100 | #153 | Good 97.2% |
| Soviet Union | 71.5 /100 | #154 | Good 97.2% |
| Ute | 71.1 /100 | #155 | Good 97.1% |
| Alsatians | 69.8 /100 | #156 | Good 97.1% |
| Immigrants | Russia | 67.6 /100 | #157 | Good 97.1% |
| Immigrants | Iran | 63.3 /100 | #158 | Good 97.1% |
| Kenyans | 62.9 /100 | #159 | Good 97.1% |
| Ugandans | 62.2 /100 | #160 | Good 97.1% |
| Immigrants | Belarus | 60.4 /100 | #161 | Good 97.1% |