Central American Indian vs Soviet Union 11th Grade
COMPARE
Central American Indian
Soviet Union
11th Grade
11th Grade Comparison
Central American Indians
Soviet Union
88.2%
11TH GRADE
0.0/ 100
METRIC RATING
324th/ 347
METRIC RANK
93.7%
11TH GRADE
99.5/ 100
METRIC RATING
78th/ 347
METRIC RANK
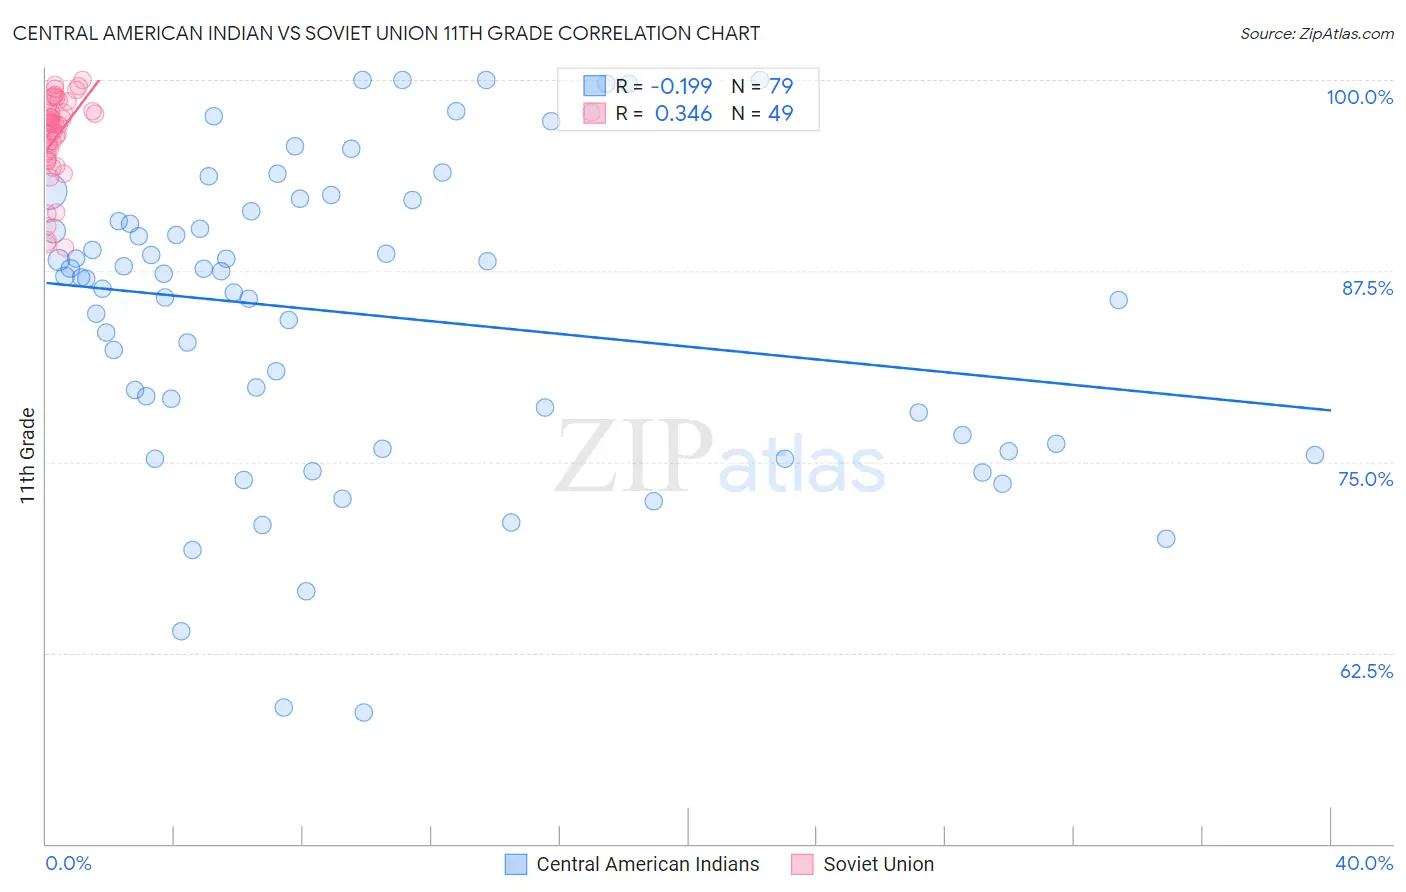
Central American Indian vs Soviet Union 11th Grade Correlation Chart
The statistical analysis conducted on geographies consisting of 326,142,643 people shows a poor negative correlation between the proportion of Central American Indians and percentage of population with at least 11th grade education in the United States with a correlation coefficient (R) of -0.199 and weighted average of 88.2%. Similarly, the statistical analysis conducted on geographies consisting of 43,454,395 people shows a mild positive correlation between the proportion of Soviet Union and percentage of population with at least 11th grade education in the United States with a correlation coefficient (R) of 0.346 and weighted average of 93.7%, a difference of 6.2%.
11th Grade Correlation Summary
| Measurement | Central American Indian | Soviet Union |
| Minimum | 58.6% | 89.0% |
| Maximum | 100.0% | 100.0% |
| Range | 41.4% | 11.0% |
| Mean | 84.6% | 96.3% |
| Median | 87.1% | 97.2% |
| Interquartile 25% (IQ1) | 76.2% | 94.9% |
| Interquartile 75% (IQ3) | 91.4% | 98.2% |
| Interquartile Range (IQR) | 15.2% | 3.4% |
| Standard Deviation (Sample) | 9.9% | 2.8% |
| Standard Deviation (Population) | 9.8% | 2.8% |
Similar Demographics by 11th Grade
Demographics Similar to Central American Indians by 11th Grade
In terms of 11th grade, the demographic groups most similar to Central American Indians are Pima (88.3%, a difference of 0.040%), Puerto Rican (88.4%, a difference of 0.12%), Immigrants from Nicaragua (88.1%, a difference of 0.13%), Immigrants from Belize (88.7%, a difference of 0.51%), and Immigrants from Armenia (88.8%, a difference of 0.60%).
| Demographics | Rating | Rank | 11th Grade |
| Lumbee | 0.0 /100 | #317 | Tragic 88.9% |
| Nicaraguans | 0.0 /100 | #318 | Tragic 88.9% |
| Belizeans | 0.0 /100 | #319 | Tragic 88.8% |
| Immigrants | Armenia | 0.0 /100 | #320 | Tragic 88.8% |
| Immigrants | Belize | 0.0 /100 | #321 | Tragic 88.7% |
| Puerto Ricans | 0.0 /100 | #322 | Tragic 88.4% |
| Pima | 0.0 /100 | #323 | Tragic 88.3% |
| Central American Indians | 0.0 /100 | #324 | Tragic 88.2% |
| Immigrants | Nicaragua | 0.0 /100 | #325 | Tragic 88.1% |
| Dominicans | 0.0 /100 | #326 | Tragic 87.7% |
| Immigrants | Cabo Verde | 0.0 /100 | #327 | Tragic 87.6% |
| Tohono O'odham | 0.0 /100 | #328 | Tragic 87.6% |
| Mexican American Indians | 0.0 /100 | #329 | Tragic 87.5% |
| Hondurans | 0.0 /100 | #330 | Tragic 87.4% |
| Hispanics or Latinos | 0.0 /100 | #331 | Tragic 87.3% |
Demographics Similar to Soviet Union by 11th Grade
In terms of 11th grade, the demographic groups most similar to Soviet Union are Aleut (93.7%, a difference of 0.0%), Celtic (93.7%, a difference of 0.010%), Immigrants from Denmark (93.7%, a difference of 0.010%), Immigrants from Latvia (93.8%, a difference of 0.030%), and Canadian (93.7%, a difference of 0.030%).
| Demographics | Rating | Rank | 11th Grade |
| Immigrants | South Africa | 99.7 /100 | #71 | Exceptional 93.8% |
| Immigrants | Japan | 99.7 /100 | #72 | Exceptional 93.8% |
| Romanians | 99.6 /100 | #73 | Exceptional 93.8% |
| Immigrants | Czechoslovakia | 99.6 /100 | #74 | Exceptional 93.8% |
| Immigrants | Latvia | 99.6 /100 | #75 | Exceptional 93.8% |
| Celtics | 99.5 /100 | #76 | Exceptional 93.7% |
| Aleuts | 99.5 /100 | #77 | Exceptional 93.7% |
| Soviet Union | 99.5 /100 | #78 | Exceptional 93.7% |
| Immigrants | Denmark | 99.5 /100 | #79 | Exceptional 93.7% |
| Canadians | 99.5 /100 | #80 | Exceptional 93.7% |
| Immigrants | Moldova | 99.5 /100 | #81 | Exceptional 93.7% |
| Immigrants | Saudi Arabia | 99.3 /100 | #82 | Exceptional 93.7% |
| Icelanders | 99.3 /100 | #83 | Exceptional 93.6% |
| Immigrants | Taiwan | 99.3 /100 | #84 | Exceptional 93.6% |
| Immigrants | Switzerland | 99.3 /100 | #85 | Exceptional 93.6% |