Central American Indian vs Immigrants from Guyana 6th Grade
COMPARE
Central American Indian
Immigrants from Guyana
6th Grade
6th Grade Comparison
Central American Indians
Immigrants from Guyana
95.1%
6TH GRADE
0.0/ 100
METRIC RATING
323rd/ 347
METRIC RANK
95.5%
6TH GRADE
0.0/ 100
METRIC RATING
312th/ 347
METRIC RANK
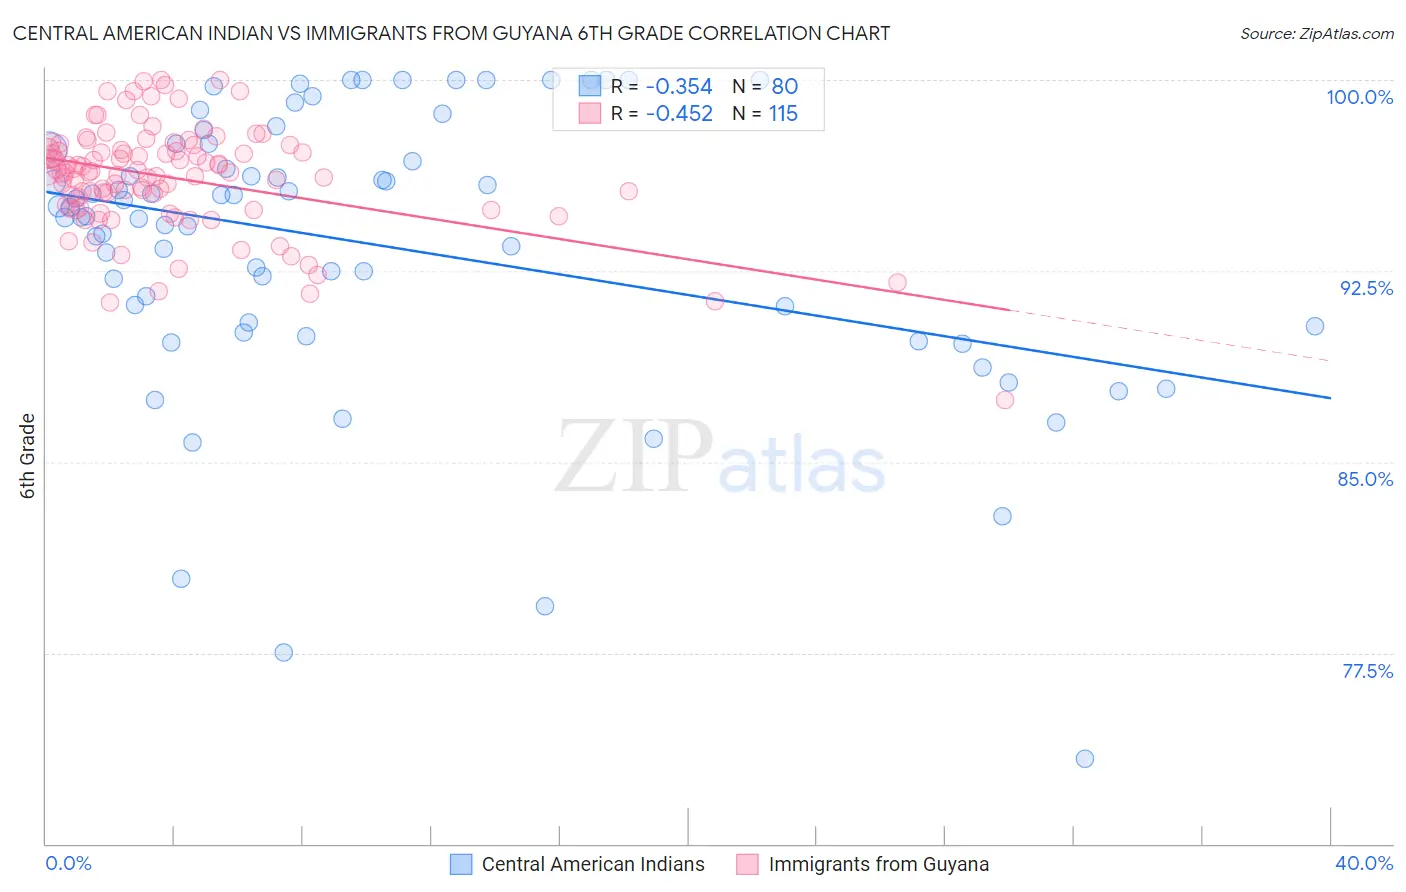
Central American Indian vs Immigrants from Guyana 6th Grade Correlation Chart
The statistical analysis conducted on geographies consisting of 326,143,005 people shows a mild negative correlation between the proportion of Central American Indians and percentage of population with at least 6th grade education in the United States with a correlation coefficient (R) of -0.354 and weighted average of 95.1%. Similarly, the statistical analysis conducted on geographies consisting of 183,673,461 people shows a moderate negative correlation between the proportion of Immigrants from Guyana and percentage of population with at least 6th grade education in the United States with a correlation coefficient (R) of -0.452 and weighted average of 95.5%, a difference of 0.34%.
6th Grade Correlation Summary
| Measurement | Central American Indian | Immigrants from Guyana |
| Minimum | 73.4% | 87.4% |
| Maximum | 100.0% | 100.0% |
| Range | 26.6% | 12.6% |
| Mean | 93.5% | 96.2% |
| Median | 94.8% | 96.4% |
| Interquartile 25% (IQ1) | 90.4% | 95.0% |
| Interquartile 75% (IQ3) | 97.4% | 97.3% |
| Interquartile Range (IQR) | 7.0% | 2.3% |
| Standard Deviation (Sample) | 5.6% | 2.1% |
| Standard Deviation (Population) | 5.5% | 2.1% |
Demographics Similar to Central American Indians and Immigrants from Guyana by 6th Grade
In terms of 6th grade, the demographic groups most similar to Central American Indians are Immigrants from Cambodia (95.2%, a difference of 0.010%), Cape Verdean (95.1%, a difference of 0.030%), Immigrants from Fiji (95.2%, a difference of 0.060%), Immigrants from Nicaragua (95.1%, a difference of 0.060%), and Immigrants from Ecuador (95.3%, a difference of 0.13%). Similarly, the demographic groups most similar to Immigrants from Guyana are Immigrants from Portugal (95.5%, a difference of 0.010%), Ecuadorian (95.5%, a difference of 0.030%), Puerto Rican (95.5%, a difference of 0.040%), Immigrants from Caribbean (95.6%, a difference of 0.090%), and Nicaraguan (95.4%, a difference of 0.090%).
| Demographics | Rating | Rank | 6th Grade |
| Guyanese | 0.0 /100 | #307 | Tragic 95.6% |
| Immigrants | Caribbean | 0.0 /100 | #308 | Tragic 95.6% |
| Puerto Ricans | 0.0 /100 | #309 | Tragic 95.5% |
| Ecuadorians | 0.0 /100 | #310 | Tragic 95.5% |
| Immigrants | Portugal | 0.0 /100 | #311 | Tragic 95.5% |
| Immigrants | Guyana | 0.0 /100 | #312 | Tragic 95.5% |
| Nicaraguans | 0.0 /100 | #313 | Tragic 95.4% |
| Immigrants | Vietnam | 0.0 /100 | #314 | Tragic 95.4% |
| Immigrants | Bangladesh | 0.0 /100 | #315 | Tragic 95.4% |
| Japanese | 0.0 /100 | #316 | Tragic 95.4% |
| Vietnamese | 0.0 /100 | #317 | Tragic 95.3% |
| Belizeans | 0.0 /100 | #318 | Tragic 95.3% |
| Immigrants | Belize | 0.0 /100 | #319 | Tragic 95.3% |
| Immigrants | Ecuador | 0.0 /100 | #320 | Tragic 95.3% |
| Immigrants | Fiji | 0.0 /100 | #321 | Tragic 95.2% |
| Immigrants | Cambodia | 0.0 /100 | #322 | Tragic 95.2% |
| Central American Indians | 0.0 /100 | #323 | Tragic 95.1% |
| Cape Verdeans | 0.0 /100 | #324 | Tragic 95.1% |
| Immigrants | Nicaragua | 0.0 /100 | #325 | Tragic 95.1% |
| Hispanics or Latinos | 0.0 /100 | #326 | Tragic 95.0% |
| Mexican American Indians | 0.0 /100 | #327 | Tragic 95.0% |