Scotch-Irish vs Soviet Union 6th Grade
COMPARE
Scotch-Irish
Soviet Union
6th Grade
6th Grade Comparison
Scotch-Irish
Soviet Union
98.0%
6TH GRADE
100.0/ 100
METRIC RATING
25th/ 347
METRIC RANK
97.2%
6TH GRADE
71.5/ 100
METRIC RATING
154th/ 347
METRIC RANK
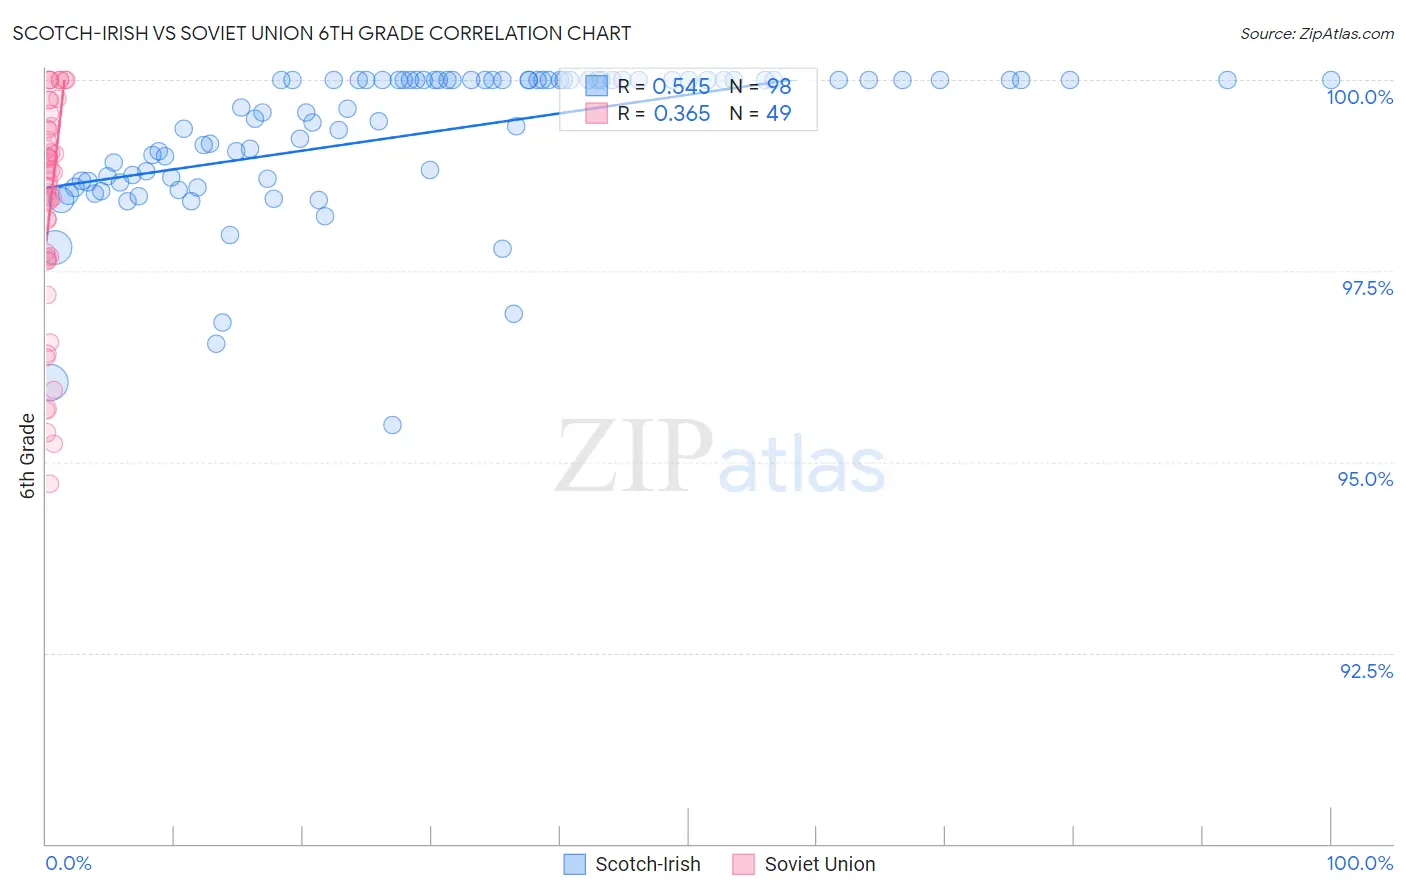
Scotch-Irish vs Soviet Union 6th Grade Correlation Chart
The statistical analysis conducted on geographies consisting of 548,777,407 people shows a substantial positive correlation between the proportion of Scotch-Irish and percentage of population with at least 6th grade education in the United States with a correlation coefficient (R) of 0.545 and weighted average of 98.0%. Similarly, the statistical analysis conducted on geographies consisting of 43,454,395 people shows a mild positive correlation between the proportion of Soviet Union and percentage of population with at least 6th grade education in the United States with a correlation coefficient (R) of 0.365 and weighted average of 97.2%, a difference of 0.90%.
6th Grade Correlation Summary
| Measurement | Scotch-Irish | Soviet Union |
| Minimum | 95.5% | 94.7% |
| Maximum | 100.0% | 100.0% |
| Range | 4.5% | 5.3% |
| Mean | 99.3% | 98.3% |
| Median | 99.8% | 98.8% |
| Interquartile 25% (IQ1) | 98.7% | 97.7% |
| Interquartile 75% (IQ3) | 100.0% | 99.4% |
| Interquartile Range (IQR) | 1.3% | 1.7% |
| Standard Deviation (Sample) | 0.95% | 1.4% |
| Standard Deviation (Population) | 0.95% | 1.4% |
Similar Demographics by 6th Grade
Demographics Similar to Scotch-Irish by 6th Grade
In terms of 6th grade, the demographic groups most similar to Scotch-Irish are Sioux (98.0%, a difference of 0.010%), Croatian (98.0%, a difference of 0.010%), Czech (98.0%, a difference of 0.010%), Danish (98.0%, a difference of 0.020%), and Yup'ik (98.0%, a difference of 0.020%).
| Demographics | Rating | Rank | 6th Grade |
| Pennsylvania Germans | 100.0 /100 | #18 | Exceptional 98.1% |
| Irish | 100.0 /100 | #19 | Exceptional 98.1% |
| Finns | 100.0 /100 | #20 | Exceptional 98.1% |
| Lithuanians | 100.0 /100 | #21 | Exceptional 98.1% |
| Danes | 100.0 /100 | #22 | Exceptional 98.0% |
| Sioux | 100.0 /100 | #23 | Exceptional 98.0% |
| Croatians | 100.0 /100 | #24 | Exceptional 98.0% |
| Scotch-Irish | 100.0 /100 | #25 | Exceptional 98.0% |
| Czechs | 100.0 /100 | #26 | Exceptional 98.0% |
| Yup'ik | 100.0 /100 | #27 | Exceptional 98.0% |
| Scandinavians | 100.0 /100 | #28 | Exceptional 98.0% |
| French | 100.0 /100 | #29 | Exceptional 98.0% |
| French Canadians | 100.0 /100 | #30 | Exceptional 98.0% |
| Europeans | 100.0 /100 | #31 | Exceptional 98.0% |
| Alaska Natives | 100.0 /100 | #32 | Exceptional 98.0% |
Demographics Similar to Soviet Union by 6th Grade
In terms of 6th grade, the demographic groups most similar to Soviet Union are Ute (97.1%, a difference of 0.0%), French American Indian (97.2%, a difference of 0.010%), Immigrants from Jordan (97.2%, a difference of 0.010%), Immigrants from Eastern Europe (97.2%, a difference of 0.010%), and Alsatian (97.1%, a difference of 0.010%).
| Demographics | Rating | Rank | 6th Grade |
| Immigrants | South Central Asia | 78.1 /100 | #147 | Good 97.2% |
| Immigrants | Greece | 77.8 /100 | #148 | Good 97.2% |
| Immigrants | Israel | 76.0 /100 | #149 | Good 97.2% |
| Immigrants | Bosnia and Herzegovina | 74.8 /100 | #150 | Good 97.2% |
| French American Indians | 74.0 /100 | #151 | Good 97.2% |
| Immigrants | Jordan | 73.0 /100 | #152 | Good 97.2% |
| Immigrants | Eastern Europe | 72.6 /100 | #153 | Good 97.2% |
| Soviet Union | 71.5 /100 | #154 | Good 97.2% |
| Ute | 71.1 /100 | #155 | Good 97.1% |
| Alsatians | 69.8 /100 | #156 | Good 97.1% |
| Immigrants | Russia | 67.6 /100 | #157 | Good 97.1% |
| Immigrants | Iran | 63.3 /100 | #158 | Good 97.1% |
| Kenyans | 62.9 /100 | #159 | Good 97.1% |
| Ugandans | 62.2 /100 | #160 | Good 97.1% |
| Immigrants | Belarus | 60.4 /100 | #161 | Good 97.1% |