Guatemalan vs Soviet Union 6th Grade
COMPARE
Guatemalan
Soviet Union
6th Grade
6th Grade Comparison
Guatemalans
Soviet Union
94.2%
6TH GRADE
0.0/ 100
METRIC RATING
340th/ 347
METRIC RANK
97.2%
6TH GRADE
71.5/ 100
METRIC RATING
154th/ 347
METRIC RANK
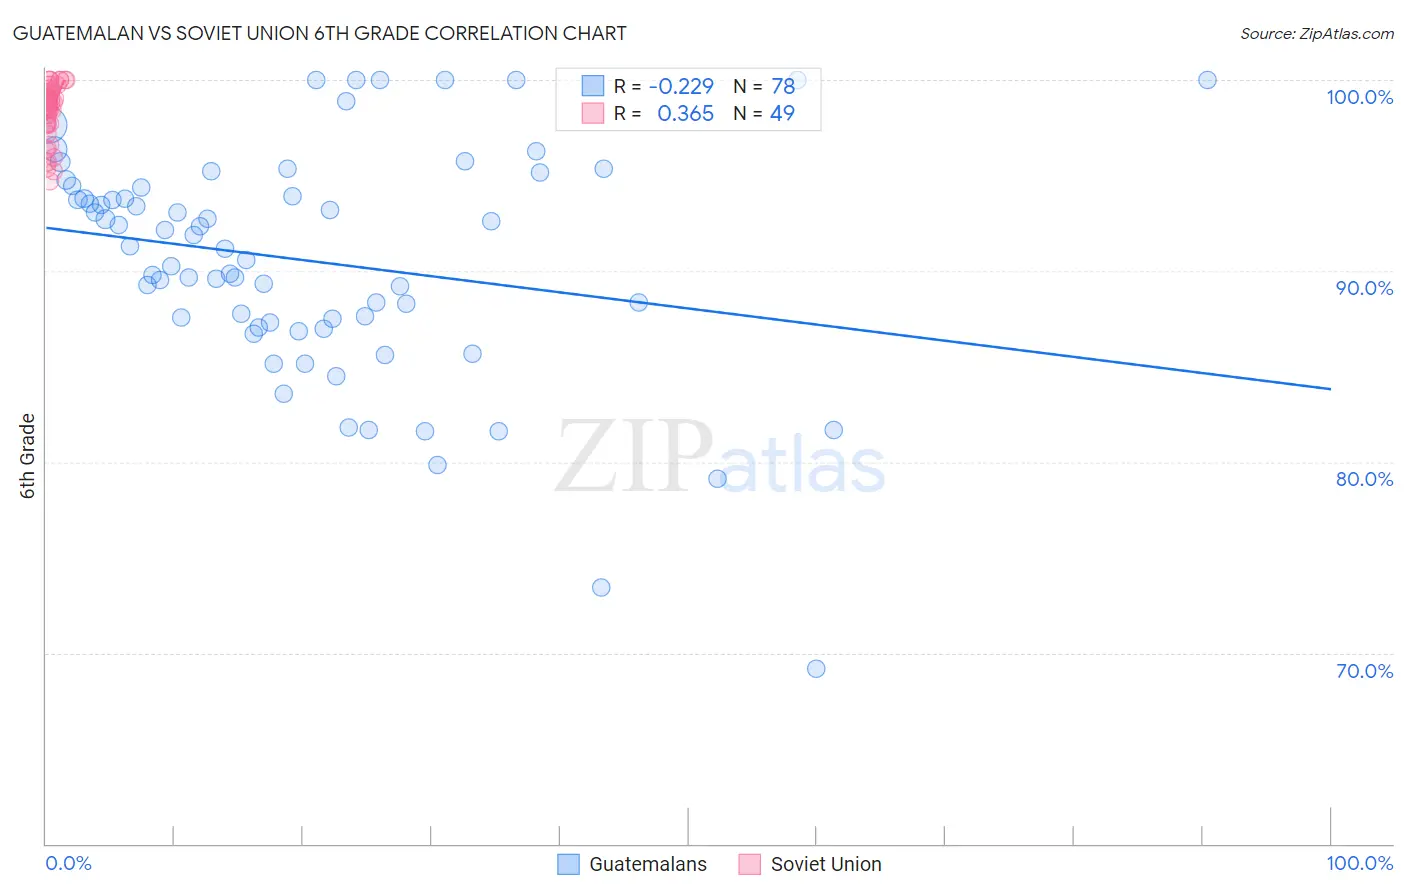
Guatemalan vs Soviet Union 6th Grade Correlation Chart
The statistical analysis conducted on geographies consisting of 409,566,469 people shows a weak negative correlation between the proportion of Guatemalans and percentage of population with at least 6th grade education in the United States with a correlation coefficient (R) of -0.229 and weighted average of 94.2%. Similarly, the statistical analysis conducted on geographies consisting of 43,454,395 people shows a mild positive correlation between the proportion of Soviet Union and percentage of population with at least 6th grade education in the United States with a correlation coefficient (R) of 0.365 and weighted average of 97.2%, a difference of 3.1%.
6th Grade Correlation Summary
| Measurement | Guatemalan | Soviet Union |
| Minimum | 69.2% | 94.7% |
| Maximum | 100.0% | 100.0% |
| Range | 30.8% | 5.3% |
| Mean | 90.5% | 98.3% |
| Median | 91.2% | 98.8% |
| Interquartile 25% (IQ1) | 87.3% | 97.7% |
| Interquartile 75% (IQ3) | 94.4% | 99.4% |
| Interquartile Range (IQR) | 7.1% | 1.7% |
| Standard Deviation (Sample) | 6.1% | 1.4% |
| Standard Deviation (Population) | 6.0% | 1.4% |
Similar Demographics by 6th Grade
Demographics Similar to Guatemalans by 6th Grade
In terms of 6th grade, the demographic groups most similar to Guatemalans are Yakama (94.3%, a difference of 0.11%), Immigrants from Yemen (94.1%, a difference of 0.11%), Immigrants from Central America (94.0%, a difference of 0.22%), Central American (94.5%, a difference of 0.26%), and Immigrants from Cabo Verde (94.4%, a difference of 0.26%).
| Demographics | Rating | Rank | 6th Grade |
| Immigrants | Latin America | 0.0 /100 | #333 | Tragic 94.7% |
| Immigrants | Azores | 0.0 /100 | #334 | Tragic 94.7% |
| Mexicans | 0.0 /100 | #335 | Tragic 94.6% |
| Immigrants | Dominican Republic | 0.0 /100 | #336 | Tragic 94.6% |
| Central Americans | 0.0 /100 | #337 | Tragic 94.5% |
| Immigrants | Cabo Verde | 0.0 /100 | #338 | Tragic 94.4% |
| Yakama | 0.0 /100 | #339 | Tragic 94.3% |
| Guatemalans | 0.0 /100 | #340 | Tragic 94.2% |
| Immigrants | Yemen | 0.0 /100 | #341 | Tragic 94.1% |
| Immigrants | Central America | 0.0 /100 | #342 | Tragic 94.0% |
| Immigrants | Mexico | 0.0 /100 | #343 | Tragic 93.9% |
| Immigrants | Guatemala | 0.0 /100 | #344 | Tragic 93.9% |
| Salvadorans | 0.0 /100 | #345 | Tragic 93.9% |
| Spanish American Indians | 0.0 /100 | #346 | Tragic 93.6% |
| Immigrants | El Salvador | 0.0 /100 | #347 | Tragic 93.6% |
Demographics Similar to Soviet Union by 6th Grade
In terms of 6th grade, the demographic groups most similar to Soviet Union are Ute (97.1%, a difference of 0.0%), French American Indian (97.2%, a difference of 0.010%), Immigrants from Jordan (97.2%, a difference of 0.010%), Immigrants from Eastern Europe (97.2%, a difference of 0.010%), and Alsatian (97.1%, a difference of 0.010%).
| Demographics | Rating | Rank | 6th Grade |
| Immigrants | South Central Asia | 78.1 /100 | #147 | Good 97.2% |
| Immigrants | Greece | 77.8 /100 | #148 | Good 97.2% |
| Immigrants | Israel | 76.0 /100 | #149 | Good 97.2% |
| Immigrants | Bosnia and Herzegovina | 74.8 /100 | #150 | Good 97.2% |
| French American Indians | 74.0 /100 | #151 | Good 97.2% |
| Immigrants | Jordan | 73.0 /100 | #152 | Good 97.2% |
| Immigrants | Eastern Europe | 72.6 /100 | #153 | Good 97.2% |
| Soviet Union | 71.5 /100 | #154 | Good 97.2% |
| Ute | 71.1 /100 | #155 | Good 97.1% |
| Alsatians | 69.8 /100 | #156 | Good 97.1% |
| Immigrants | Russia | 67.6 /100 | #157 | Good 97.1% |
| Immigrants | Iran | 63.3 /100 | #158 | Good 97.1% |
| Kenyans | 62.9 /100 | #159 | Good 97.1% |
| Ugandans | 62.2 /100 | #160 | Good 97.1% |
| Immigrants | Belarus | 60.4 /100 | #161 | Good 97.1% |