Central American Indian vs Norwegian Kindergarten
COMPARE
Central American Indian
Norwegian
Kindergarten
Kindergarten Comparison
Central American Indians
Norwegians
97.2%
KINDERGARTEN
0.0/ 100
METRIC RATING
297th/ 347
METRIC RANK
98.7%
KINDERGARTEN
100.0/ 100
METRIC RATING
8th/ 347
METRIC RANK
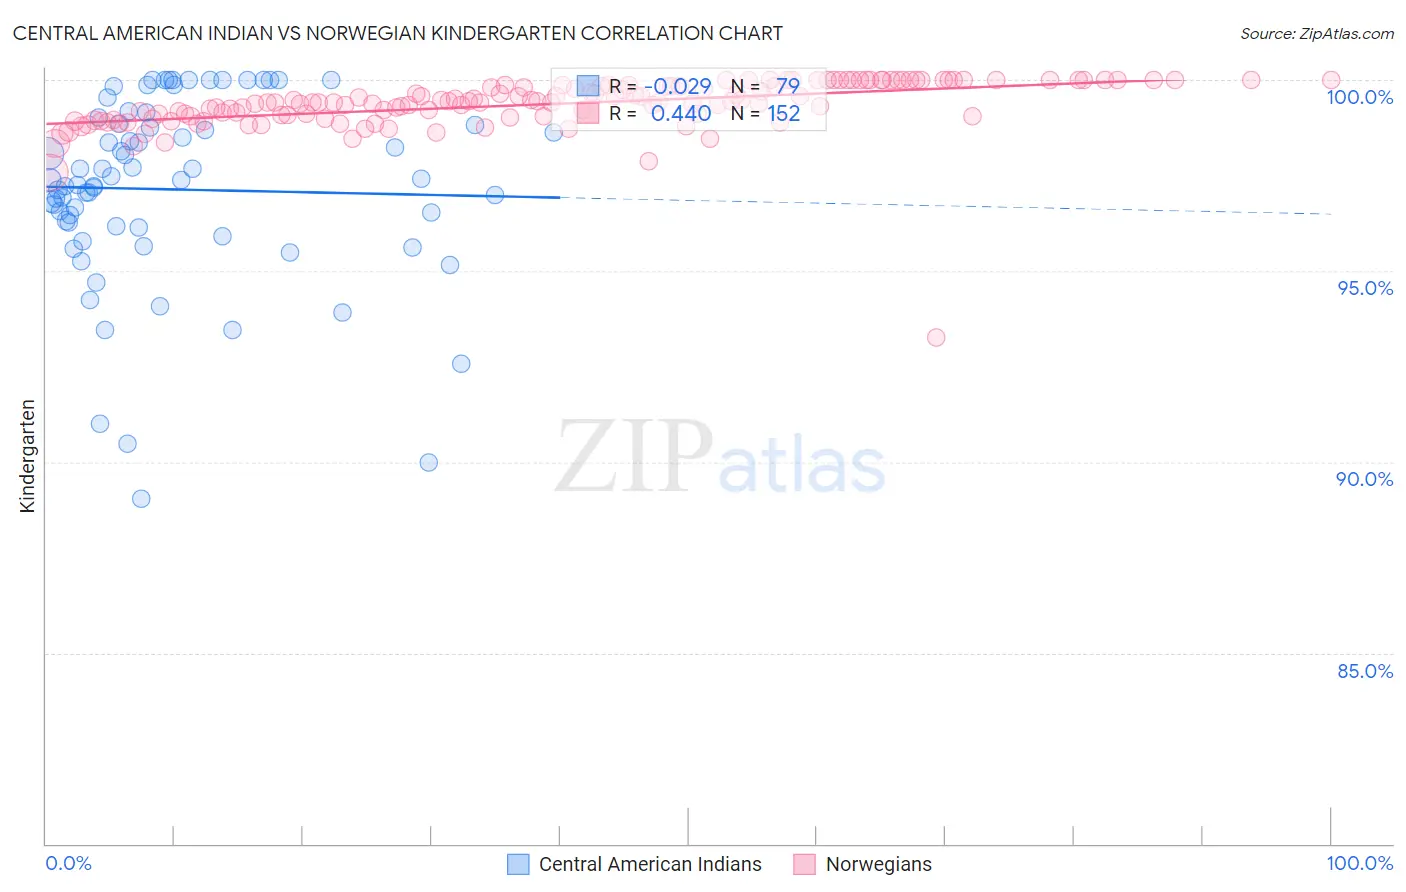
Central American Indian vs Norwegian Kindergarten Correlation Chart
The statistical analysis conducted on geographies consisting of 326,141,567 people shows no correlation between the proportion of Central American Indians and percentage of population with at least kindergarten education in the United States with a correlation coefficient (R) of -0.029 and weighted average of 97.2%. Similarly, the statistical analysis conducted on geographies consisting of 533,395,488 people shows a moderate positive correlation between the proportion of Norwegians and percentage of population with at least kindergarten education in the United States with a correlation coefficient (R) of 0.440 and weighted average of 98.7%, a difference of 1.6%.
Kindergarten Correlation Summary
| Measurement | Central American Indian | Norwegian |
| Minimum | 89.0% | 93.2% |
| Maximum | 100.0% | 100.0% |
| Range | 11.0% | 6.8% |
| Mean | 97.1% | 99.4% |
| Median | 97.4% | 99.4% |
| Interquartile 25% (IQ1) | 96.2% | 99.0% |
| Interquartile 75% (IQ3) | 98.9% | 99.9% |
| Interquartile Range (IQR) | 2.7% | 0.83% |
| Standard Deviation (Sample) | 2.5% | 0.71% |
| Standard Deviation (Population) | 2.4% | 0.71% |
Similar Demographics by Kindergarten
Demographics Similar to Central American Indians by Kindergarten
In terms of kindergarten, the demographic groups most similar to Central American Indians are Immigrants from Dominica (97.1%, a difference of 0.020%), Immigrants from Cuba (97.1%, a difference of 0.030%), Haitian (97.1%, a difference of 0.040%), Immigrants from Eritrea (97.2%, a difference of 0.050%), and Immigrants from South Eastern Asia (97.1%, a difference of 0.050%).
| Demographics | Rating | Rank | Kindergarten |
| Immigrants | St. Vincent and the Grenadines | 0.0 /100 | #290 | Tragic 97.3% |
| Houma | 0.0 /100 | #291 | Tragic 97.3% |
| British West Indians | 0.0 /100 | #292 | Tragic 97.3% |
| Malaysians | 0.0 /100 | #293 | Tragic 97.2% |
| Immigrants | Immigrants | 0.0 /100 | #294 | Tragic 97.2% |
| Immigrants | Grenada | 0.0 /100 | #295 | Tragic 97.2% |
| Immigrants | Eritrea | 0.0 /100 | #296 | Tragic 97.2% |
| Central American Indians | 0.0 /100 | #297 | Tragic 97.2% |
| Immigrants | Dominica | 0.0 /100 | #298 | Tragic 97.1% |
| Immigrants | Cuba | 0.0 /100 | #299 | Tragic 97.1% |
| Haitians | 0.0 /100 | #300 | Tragic 97.1% |
| Immigrants | South Eastern Asia | 0.0 /100 | #301 | Tragic 97.1% |
| Immigrants | Caribbean | 0.0 /100 | #302 | Tragic 97.1% |
| Somalis | 0.0 /100 | #303 | Tragic 97.0% |
| Nicaraguans | 0.0 /100 | #304 | Tragic 97.0% |
Demographics Similar to Norwegians by Kindergarten
In terms of kindergarten, the demographic groups most similar to Norwegians are Tlingit-Haida (98.7%, a difference of 0.010%), Alaska Native (98.7%, a difference of 0.020%), Slovak (98.7%, a difference of 0.020%), German (98.7%, a difference of 0.020%), and Slovene (98.7%, a difference of 0.040%).
| Demographics | Rating | Rank | Kindergarten |
| Crow | 100.0 /100 | #1 | Exceptional 99.7% |
| Yup'ik | 100.0 /100 | #2 | Exceptional 99.2% |
| Inupiat | 100.0 /100 | #3 | Exceptional 98.9% |
| Welsh | 100.0 /100 | #4 | Exceptional 98.9% |
| Tsimshian | 100.0 /100 | #5 | Exceptional 98.8% |
| Alaskan Athabascans | 100.0 /100 | #6 | Exceptional 98.8% |
| Alaska Natives | 100.0 /100 | #7 | Exceptional 98.7% |
| Norwegians | 100.0 /100 | #8 | Exceptional 98.7% |
| Tlingit-Haida | 100.0 /100 | #9 | Exceptional 98.7% |
| Slovaks | 100.0 /100 | #10 | Exceptional 98.7% |
| Germans | 100.0 /100 | #11 | Exceptional 98.7% |
| Slovenes | 100.0 /100 | #12 | Exceptional 98.7% |
| Carpatho Rusyns | 100.0 /100 | #13 | Exceptional 98.7% |
| English | 100.0 /100 | #14 | Exceptional 98.7% |
| Swedes | 100.0 /100 | #15 | Exceptional 98.7% |