Central American Indian vs Immigrants from Indonesia Kindergarten
COMPARE
Central American Indian
Immigrants from Indonesia
Kindergarten
Kindergarten Comparison
Central American Indians
Immigrants from Indonesia
97.2%
KINDERGARTEN
0.0/ 100
METRIC RATING
297th/ 347
METRIC RANK
97.6%
KINDERGARTEN
1.3/ 100
METRIC RATING
242nd/ 347
METRIC RANK
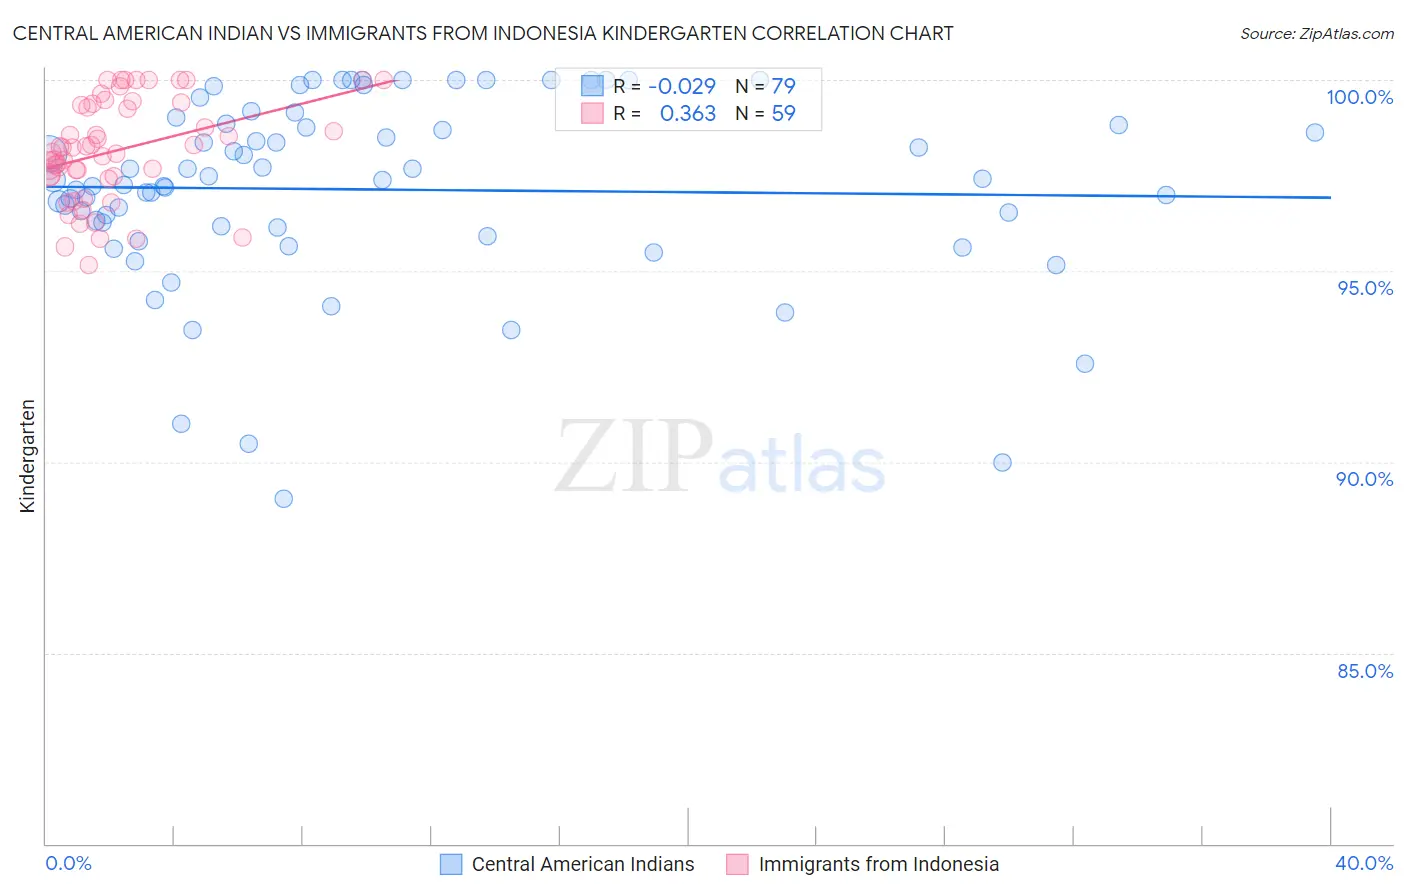
Central American Indian vs Immigrants from Indonesia Kindergarten Correlation Chart
The statistical analysis conducted on geographies consisting of 326,141,567 people shows no correlation between the proportion of Central American Indians and percentage of population with at least kindergarten education in the United States with a correlation coefficient (R) of -0.029 and weighted average of 97.2%. Similarly, the statistical analysis conducted on geographies consisting of 215,782,971 people shows a mild positive correlation between the proportion of Immigrants from Indonesia and percentage of population with at least kindergarten education in the United States with a correlation coefficient (R) of 0.363 and weighted average of 97.6%, a difference of 0.48%.
Kindergarten Correlation Summary
| Measurement | Central American Indian | Immigrants from Indonesia |
| Minimum | 89.0% | 95.2% |
| Maximum | 100.0% | 100.0% |
| Range | 11.0% | 4.8% |
| Mean | 97.1% | 98.2% |
| Median | 97.4% | 98.2% |
| Interquartile 25% (IQ1) | 96.2% | 97.5% |
| Interquartile 75% (IQ3) | 98.9% | 99.4% |
| Interquartile Range (IQR) | 2.7% | 1.9% |
| Standard Deviation (Sample) | 2.5% | 1.3% |
| Standard Deviation (Population) | 2.4% | 1.3% |
Similar Demographics by Kindergarten
Demographics Similar to Central American Indians by Kindergarten
In terms of kindergarten, the demographic groups most similar to Central American Indians are Immigrants from Dominica (97.1%, a difference of 0.020%), Immigrants from Cuba (97.1%, a difference of 0.030%), Haitian (97.1%, a difference of 0.040%), Immigrants from Eritrea (97.2%, a difference of 0.050%), and Immigrants from South Eastern Asia (97.1%, a difference of 0.050%).
| Demographics | Rating | Rank | Kindergarten |
| Immigrants | St. Vincent and the Grenadines | 0.0 /100 | #290 | Tragic 97.3% |
| Houma | 0.0 /100 | #291 | Tragic 97.3% |
| British West Indians | 0.0 /100 | #292 | Tragic 97.3% |
| Malaysians | 0.0 /100 | #293 | Tragic 97.2% |
| Immigrants | Immigrants | 0.0 /100 | #294 | Tragic 97.2% |
| Immigrants | Grenada | 0.0 /100 | #295 | Tragic 97.2% |
| Immigrants | Eritrea | 0.0 /100 | #296 | Tragic 97.2% |
| Central American Indians | 0.0 /100 | #297 | Tragic 97.2% |
| Immigrants | Dominica | 0.0 /100 | #298 | Tragic 97.1% |
| Immigrants | Cuba | 0.0 /100 | #299 | Tragic 97.1% |
| Haitians | 0.0 /100 | #300 | Tragic 97.1% |
| Immigrants | South Eastern Asia | 0.0 /100 | #301 | Tragic 97.1% |
| Immigrants | Caribbean | 0.0 /100 | #302 | Tragic 97.1% |
| Somalis | 0.0 /100 | #303 | Tragic 97.0% |
| Nicaraguans | 0.0 /100 | #304 | Tragic 97.0% |
Demographics Similar to Immigrants from Indonesia by Kindergarten
In terms of kindergarten, the demographic groups most similar to Immigrants from Indonesia are Liberian (97.6%, a difference of 0.0%), Asian (97.6%, a difference of 0.010%), Bolivian (97.6%, a difference of 0.010%), South American (97.6%, a difference of 0.010%), and Immigrants from Eastern Asia (97.6%, a difference of 0.020%).
| Demographics | Rating | Rank | Kindergarten |
| Colombians | 2.2 /100 | #235 | Tragic 97.7% |
| Immigrants | Western Asia | 2.1 /100 | #236 | Tragic 97.7% |
| Nigerians | 1.8 /100 | #237 | Tragic 97.6% |
| Immigrants | Eastern Asia | 1.7 /100 | #238 | Tragic 97.6% |
| U.S. Virgin Islanders | 1.7 /100 | #239 | Tragic 97.6% |
| Koreans | 1.6 /100 | #240 | Tragic 97.6% |
| Liberians | 1.3 /100 | #241 | Tragic 97.6% |
| Immigrants | Indonesia | 1.3 /100 | #242 | Tragic 97.6% |
| Asians | 1.2 /100 | #243 | Tragic 97.6% |
| Bolivians | 1.2 /100 | #244 | Tragic 97.6% |
| South Americans | 1.1 /100 | #245 | Tragic 97.6% |
| Indians (Asian) | 1.0 /100 | #246 | Tragic 97.6% |
| Immigrants | Eastern Africa | 1.0 /100 | #247 | Tragic 97.6% |
| Immigrants | Middle Africa | 1.0 /100 | #248 | Tragic 97.6% |
| Peruvians | 1.0 /100 | #249 | Tragic 97.6% |