Central American Indian vs Immigrants from Barbados Kindergarten
COMPARE
Central American Indian
Immigrants from Barbados
Kindergarten
Kindergarten Comparison
Central American Indians
Immigrants from Barbados
97.2%
KINDERGARTEN
0.0/ 100
METRIC RATING
297th/ 347
METRIC RANK
97.3%
KINDERGARTEN
0.0/ 100
METRIC RATING
286th/ 347
METRIC RANK
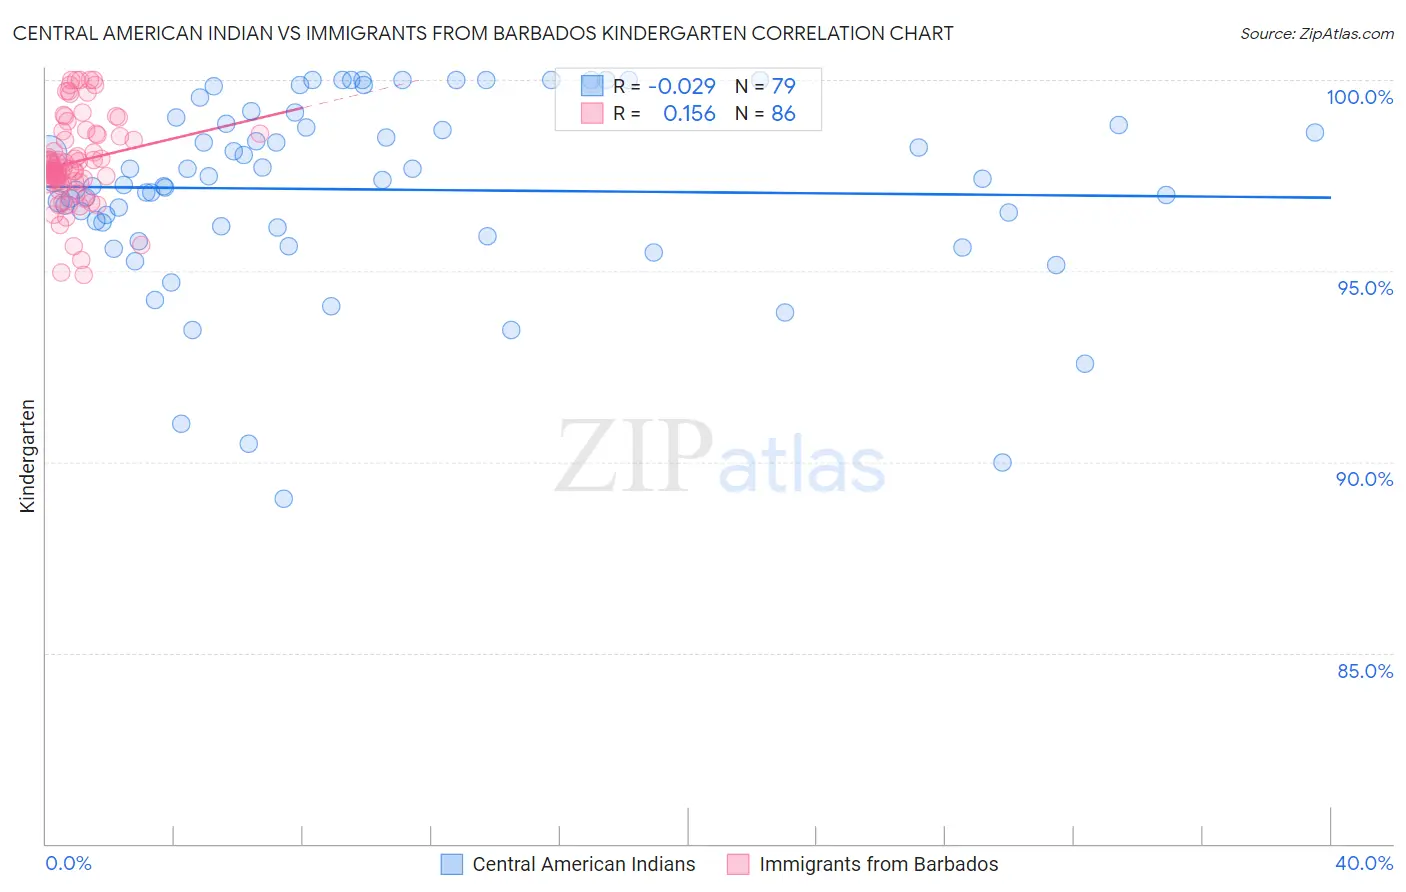
Central American Indian vs Immigrants from Barbados Kindergarten Correlation Chart
The statistical analysis conducted on geographies consisting of 326,141,567 people shows no correlation between the proportion of Central American Indians and percentage of population with at least kindergarten education in the United States with a correlation coefficient (R) of -0.029 and weighted average of 97.2%. Similarly, the statistical analysis conducted on geographies consisting of 112,787,503 people shows a poor positive correlation between the proportion of Immigrants from Barbados and percentage of population with at least kindergarten education in the United States with a correlation coefficient (R) of 0.156 and weighted average of 97.3%, a difference of 0.17%.
Kindergarten Correlation Summary
| Measurement | Central American Indian | Immigrants from Barbados |
| Minimum | 89.0% | 94.9% |
| Maximum | 100.0% | 100.0% |
| Range | 11.0% | 5.1% |
| Mean | 97.1% | 97.9% |
| Median | 97.4% | 97.7% |
| Interquartile 25% (IQ1) | 96.2% | 97.4% |
| Interquartile 75% (IQ3) | 98.9% | 98.6% |
| Interquartile Range (IQR) | 2.7% | 1.2% |
| Standard Deviation (Sample) | 2.5% | 1.1% |
| Standard Deviation (Population) | 2.4% | 1.1% |
Demographics Similar to Central American Indians and Immigrants from Barbados by Kindergarten
In terms of kindergarten, the demographic groups most similar to Central American Indians are Immigrants from Dominica (97.1%, a difference of 0.020%), Immigrants from Cuba (97.1%, a difference of 0.030%), Haitian (97.1%, a difference of 0.040%), Immigrants from Eritrea (97.2%, a difference of 0.050%), and Immigrants from South Eastern Asia (97.1%, a difference of 0.050%). Similarly, the demographic groups most similar to Immigrants from Barbados are Immigrants from Hong Kong (97.3%, a difference of 0.0%), Immigrants from Portugal (97.3%, a difference of 0.010%), Immigrants from Thailand (97.3%, a difference of 0.010%), Immigrants from Trinidad and Tobago (97.3%, a difference of 0.020%), and Immigrants from West Indies (97.3%, a difference of 0.030%).
| Demographics | Rating | Rank | Kindergarten |
| Trinidadians and Tobagonians | 0.1 /100 | #281 | Tragic 97.4% |
| Afghans | 0.0 /100 | #282 | Tragic 97.4% |
| Immigrants | West Indies | 0.0 /100 | #283 | Tragic 97.3% |
| Immigrants | Trinidad and Tobago | 0.0 /100 | #284 | Tragic 97.3% |
| Immigrants | Portugal | 0.0 /100 | #285 | Tragic 97.3% |
| Immigrants | Barbados | 0.0 /100 | #286 | Tragic 97.3% |
| Immigrants | Hong Kong | 0.0 /100 | #287 | Tragic 97.3% |
| Immigrants | Thailand | 0.0 /100 | #288 | Tragic 97.3% |
| Immigrants | Afghanistan | 0.0 /100 | #289 | Tragic 97.3% |
| Immigrants | St. Vincent and the Grenadines | 0.0 /100 | #290 | Tragic 97.3% |
| Houma | 0.0 /100 | #291 | Tragic 97.3% |
| British West Indians | 0.0 /100 | #292 | Tragic 97.3% |
| Malaysians | 0.0 /100 | #293 | Tragic 97.2% |
| Immigrants | Immigrants | 0.0 /100 | #294 | Tragic 97.2% |
| Immigrants | Grenada | 0.0 /100 | #295 | Tragic 97.2% |
| Immigrants | Eritrea | 0.0 /100 | #296 | Tragic 97.2% |
| Central American Indians | 0.0 /100 | #297 | Tragic 97.2% |
| Immigrants | Dominica | 0.0 /100 | #298 | Tragic 97.1% |
| Immigrants | Cuba | 0.0 /100 | #299 | Tragic 97.1% |
| Haitians | 0.0 /100 | #300 | Tragic 97.1% |
| Immigrants | South Eastern Asia | 0.0 /100 | #301 | Tragic 97.1% |