Central American Indian vs Immigrants from Indonesia Unemployment Among Ages 20 to 24 years
COMPARE
Central American Indian
Immigrants from Indonesia
Unemployment Among Ages 20 to 24 years
Unemployment Among Ages 20 to 24 years Comparison
Central American Indians
Immigrants from Indonesia
11.9%
UNEMPLOYMENT AMONG AGES 20 TO 24 YEARS
0.0/ 100
METRIC RATING
291st/ 347
METRIC RANK
10.1%
UNEMPLOYMENT AMONG AGES 20 TO 24 YEARS
92.7/ 100
METRIC RATING
111th/ 347
METRIC RANK
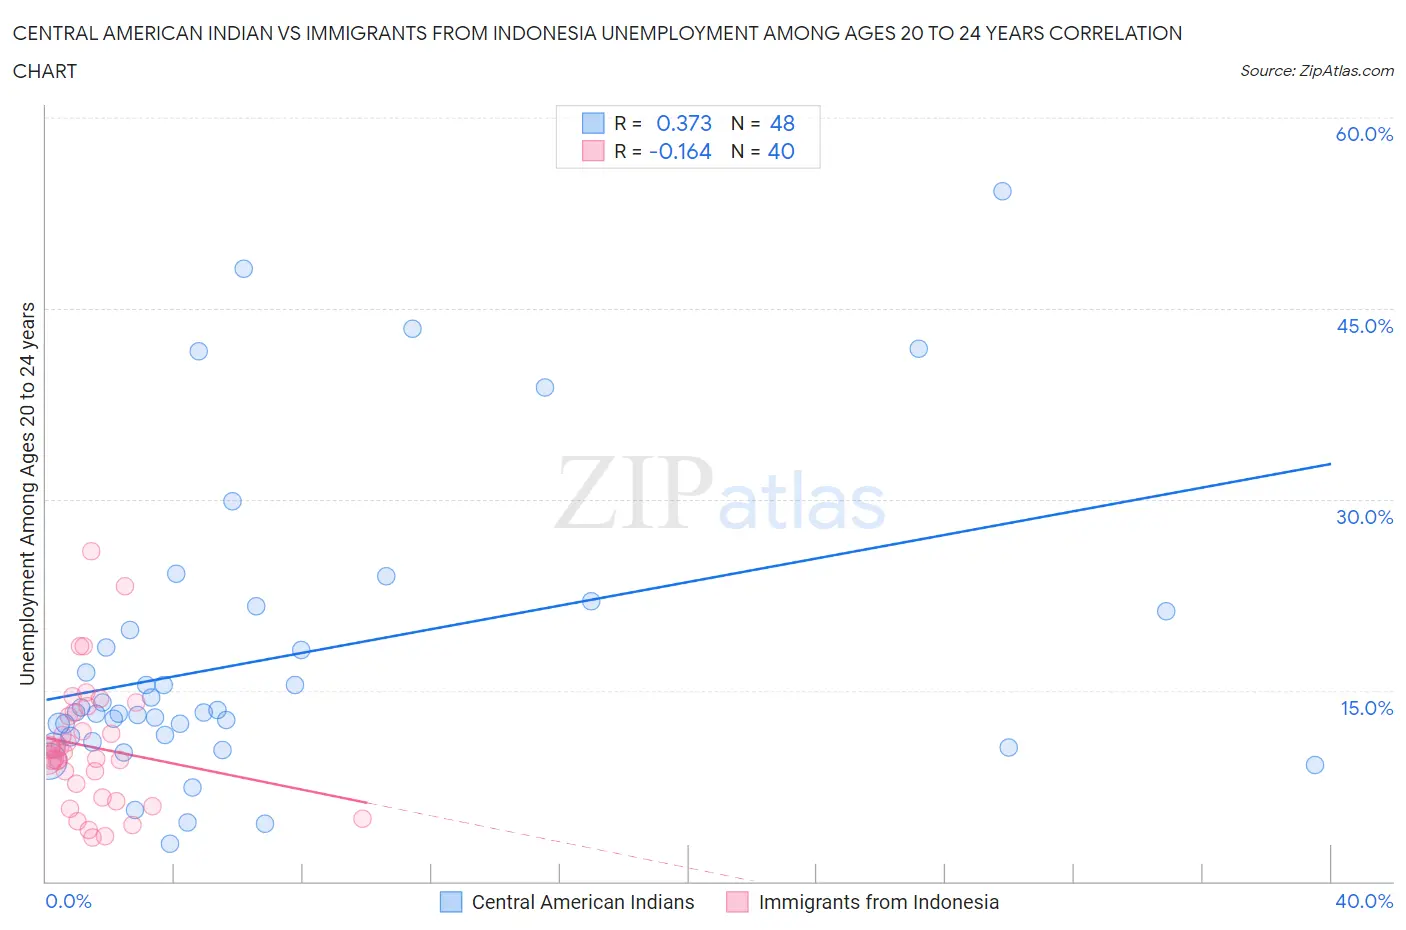
Central American Indian vs Immigrants from Indonesia Unemployment Among Ages 20 to 24 years Correlation Chart
The statistical analysis conducted on geographies consisting of 320,123,925 people shows a mild positive correlation between the proportion of Central American Indians and unemployment rate among population between the ages 20 and 24 in the United States with a correlation coefficient (R) of 0.373 and weighted average of 11.9%. Similarly, the statistical analysis conducted on geographies consisting of 213,434,370 people shows a poor negative correlation between the proportion of Immigrants from Indonesia and unemployment rate among population between the ages 20 and 24 in the United States with a correlation coefficient (R) of -0.164 and weighted average of 10.1%, a difference of 18.3%.
Unemployment Among Ages 20 to 24 years Correlation Summary
| Measurement | Central American Indian | Immigrants from Indonesia |
| Minimum | 2.9% | 3.4% |
| Maximum | 54.2% | 26.0% |
| Range | 51.3% | 22.6% |
| Mean | 17.6% | 10.6% |
| Median | 13.3% | 9.9% |
| Interquartile 25% (IQ1) | 11.2% | 7.1% |
| Interquartile 75% (IQ3) | 20.5% | 13.1% |
| Interquartile Range (IQR) | 9.3% | 6.0% |
| Standard Deviation (Sample) | 11.7% | 5.0% |
| Standard Deviation (Population) | 11.6% | 4.9% |
Similar Demographics by Unemployment Among Ages 20 to 24 years
Demographics Similar to Central American Indians by Unemployment Among Ages 20 to 24 years
In terms of unemployment among ages 20 to 24 years, the demographic groups most similar to Central American Indians are Immigrants from Senegal (11.9%, a difference of 0.080%), Immigrants from Ghana (11.9%, a difference of 0.31%), Immigrants from Belize (12.0%, a difference of 0.34%), Immigrants from Armenia (12.0%, a difference of 0.52%), and Cajun (12.0%, a difference of 0.55%).
| Demographics | Rating | Rank | Unemployment Among Ages 20 to 24 years |
| Immigrants | Western Africa | 0.0 /100 | #284 | Tragic 11.7% |
| Soviet Union | 0.0 /100 | #285 | Tragic 11.7% |
| Ecuadorians | 0.0 /100 | #286 | Tragic 11.8% |
| Immigrants | Ecuador | 0.0 /100 | #287 | Tragic 11.8% |
| U.S. Virgin Islanders | 0.0 /100 | #288 | Tragic 11.8% |
| Belizeans | 0.0 /100 | #289 | Tragic 11.8% |
| Immigrants | Caribbean | 0.0 /100 | #290 | Tragic 11.8% |
| Central American Indians | 0.0 /100 | #291 | Tragic 11.9% |
| Immigrants | Senegal | 0.0 /100 | #292 | Tragic 11.9% |
| Immigrants | Ghana | 0.0 /100 | #293 | Tragic 11.9% |
| Immigrants | Belize | 0.0 /100 | #294 | Tragic 12.0% |
| Immigrants | Armenia | 0.0 /100 | #295 | Tragic 12.0% |
| Cajuns | 0.0 /100 | #296 | Tragic 12.0% |
| Blackfeet | 0.0 /100 | #297 | Tragic 12.0% |
| Lumbee | 0.0 /100 | #298 | Tragic 12.0% |
Demographics Similar to Immigrants from Indonesia by Unemployment Among Ages 20 to 24 years
In terms of unemployment among ages 20 to 24 years, the demographic groups most similar to Immigrants from Indonesia are Northern European (10.1%, a difference of 0.010%), German Russian (10.1%, a difference of 0.040%), Immigrants from Spain (10.1%, a difference of 0.060%), Immigrants from Latvia (10.1%, a difference of 0.070%), and Filipino (10.1%, a difference of 0.070%).
| Demographics | Rating | Rank | Unemployment Among Ages 20 to 24 years |
| Immigrants | Chile | 94.0 /100 | #104 | Exceptional 10.0% |
| Immigrants | Hungary | 94.0 /100 | #105 | Exceptional 10.0% |
| Pennsylvania Germans | 93.9 /100 | #106 | Exceptional 10.0% |
| Iroquois | 93.4 /100 | #107 | Exceptional 10.1% |
| Immigrants | Latvia | 93.2 /100 | #108 | Exceptional 10.1% |
| Filipinos | 93.2 /100 | #109 | Exceptional 10.1% |
| Immigrants | Spain | 93.1 /100 | #110 | Exceptional 10.1% |
| Immigrants | Indonesia | 92.7 /100 | #111 | Exceptional 10.1% |
| Northern Europeans | 92.7 /100 | #112 | Exceptional 10.1% |
| German Russians | 92.4 /100 | #113 | Exceptional 10.1% |
| Ottawa | 90.8 /100 | #114 | Exceptional 10.1% |
| Immigrants | Morocco | 90.5 /100 | #115 | Exceptional 10.1% |
| Basques | 89.8 /100 | #116 | Excellent 10.1% |
| Immigrants | Uruguay | 89.6 /100 | #117 | Excellent 10.1% |
| Paraguayans | 88.6 /100 | #118 | Excellent 10.1% |