Celtic vs Immigrants from Western Africa High School Diploma
COMPARE
Celtic
Immigrants from Western Africa
High School Diploma
High School Diploma Comparison
Celtics
Immigrants from Western Africa
90.6%
HIGH SCHOOL DIPLOMA
98.7/ 100
METRIC RATING
90th/ 347
METRIC RANK
87.4%
HIGH SCHOOL DIPLOMA
0.5/ 100
METRIC RATING
259th/ 347
METRIC RANK
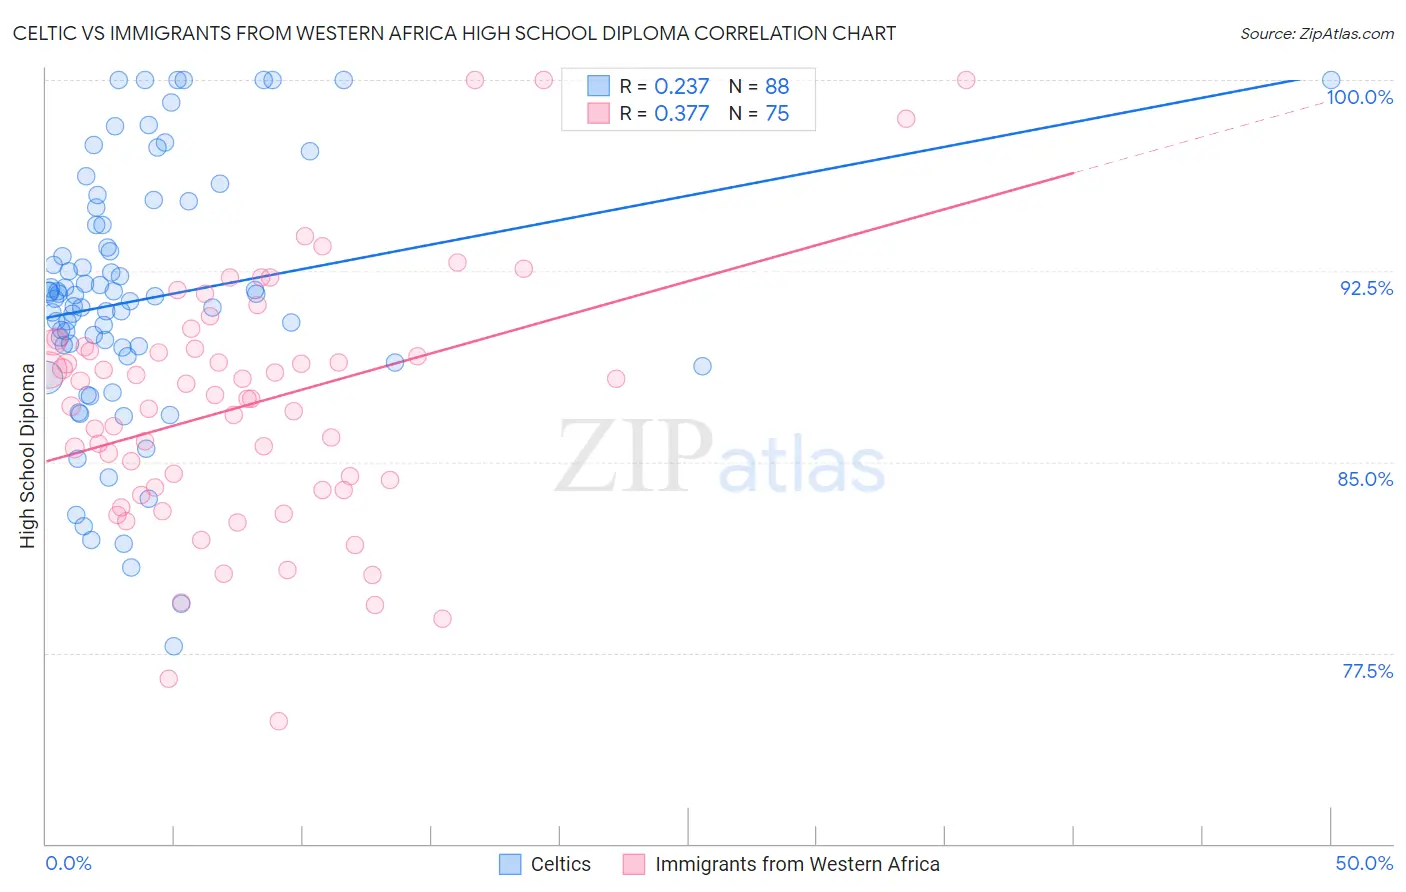
Celtic vs Immigrants from Western Africa High School Diploma Correlation Chart
The statistical analysis conducted on geographies consisting of 168,876,981 people shows a weak positive correlation between the proportion of Celtics and percentage of population with at least high school diploma education in the United States with a correlation coefficient (R) of 0.237 and weighted average of 90.6%. Similarly, the statistical analysis conducted on geographies consisting of 357,882,128 people shows a mild positive correlation between the proportion of Immigrants from Western Africa and percentage of population with at least high school diploma education in the United States with a correlation coefficient (R) of 0.377 and weighted average of 87.4%, a difference of 3.7%.
High School Diploma Correlation Summary
| Measurement | Celtic | Immigrants from Western Africa |
| Minimum | 77.8% | 74.8% |
| Maximum | 100.0% | 100.0% |
| Range | 22.2% | 25.2% |
| Mean | 91.4% | 87.3% |
| Median | 91.4% | 87.5% |
| Interquartile 25% (IQ1) | 89.3% | 83.9% |
| Interquartile 75% (IQ3) | 94.3% | 89.5% |
| Interquartile Range (IQR) | 5.0% | 5.6% |
| Standard Deviation (Sample) | 5.0% | 5.0% |
| Standard Deviation (Population) | 5.0% | 4.9% |
Similar Demographics by High School Diploma
Demographics Similar to Celtics by High School Diploma
In terms of high school diploma, the demographic groups most similar to Celtics are Canadian (90.6%, a difference of 0.010%), South African (90.6%, a difference of 0.020%), Immigrants from France (90.6%, a difference of 0.030%), Swiss (90.6%, a difference of 0.030%), and Immigrants from Western Europe (90.6%, a difference of 0.040%).
| Demographics | Rating | Rank | High School Diploma |
| Immigrants | Moldova | 99.2 /100 | #83 | Exceptional 90.7% |
| Immigrants | Saudi Arabia | 99.1 /100 | #84 | Exceptional 90.7% |
| Romanians | 98.9 /100 | #85 | Exceptional 90.7% |
| Immigrants | Bulgaria | 98.9 /100 | #86 | Exceptional 90.6% |
| Immigrants | Turkey | 98.9 /100 | #87 | Exceptional 90.6% |
| Immigrants | France | 98.8 /100 | #88 | Exceptional 90.6% |
| Canadians | 98.7 /100 | #89 | Exceptional 90.6% |
| Celtics | 98.7 /100 | #90 | Exceptional 90.6% |
| South Africans | 98.6 /100 | #91 | Exceptional 90.6% |
| Swiss | 98.6 /100 | #92 | Exceptional 90.6% |
| Immigrants | Western Europe | 98.6 /100 | #93 | Exceptional 90.6% |
| Immigrants | Israel | 98.5 /100 | #94 | Exceptional 90.5% |
| Icelanders | 98.5 /100 | #95 | Exceptional 90.5% |
| Immigrants | Serbia | 98.4 /100 | #96 | Exceptional 90.5% |
| Immigrants | Kuwait | 98.3 /100 | #97 | Exceptional 90.5% |
Demographics Similar to Immigrants from Western Africa by High School Diploma
In terms of high school diploma, the demographic groups most similar to Immigrants from Western Africa are Immigrants from Ghana (87.4%, a difference of 0.010%), Cajun (87.3%, a difference of 0.080%), Seminole (87.3%, a difference of 0.10%), Bahamian (87.5%, a difference of 0.11%), and African (87.5%, a difference of 0.12%).
| Demographics | Rating | Rank | High School Diploma |
| Immigrants | South America | 1.2 /100 | #252 | Tragic 87.6% |
| Immigrants | Uruguay | 1.0 /100 | #253 | Tragic 87.6% |
| Immigrants | Colombia | 1.0 /100 | #254 | Tragic 87.6% |
| Immigrants | Senegal | 0.9 /100 | #255 | Tragic 87.6% |
| Africans | 0.7 /100 | #256 | Tragic 87.5% |
| Bahamians | 0.7 /100 | #257 | Tragic 87.5% |
| Immigrants | Ghana | 0.5 /100 | #258 | Tragic 87.4% |
| Immigrants | Western Africa | 0.5 /100 | #259 | Tragic 87.4% |
| Cajuns | 0.4 /100 | #260 | Tragic 87.3% |
| Seminole | 0.4 /100 | #261 | Tragic 87.3% |
| Immigrants | Peru | 0.4 /100 | #262 | Tragic 87.3% |
| Immigrants | South Eastern Asia | 0.3 /100 | #263 | Tragic 87.2% |
| Jamaicans | 0.3 /100 | #264 | Tragic 87.2% |
| U.S. Virgin Islanders | 0.2 /100 | #265 | Tragic 87.1% |
| Immigrants | Congo | 0.2 /100 | #266 | Tragic 87.0% |