Celtic vs Korean High School Diploma
COMPARE
Celtic
Korean
High School Diploma
High School Diploma Comparison
Celtics
Koreans
90.6%
HIGH SCHOOL DIPLOMA
98.7/ 100
METRIC RATING
90th/ 347
METRIC RANK
88.6%
HIGH SCHOOL DIPLOMA
18.1/ 100
METRIC RATING
201st/ 347
METRIC RANK
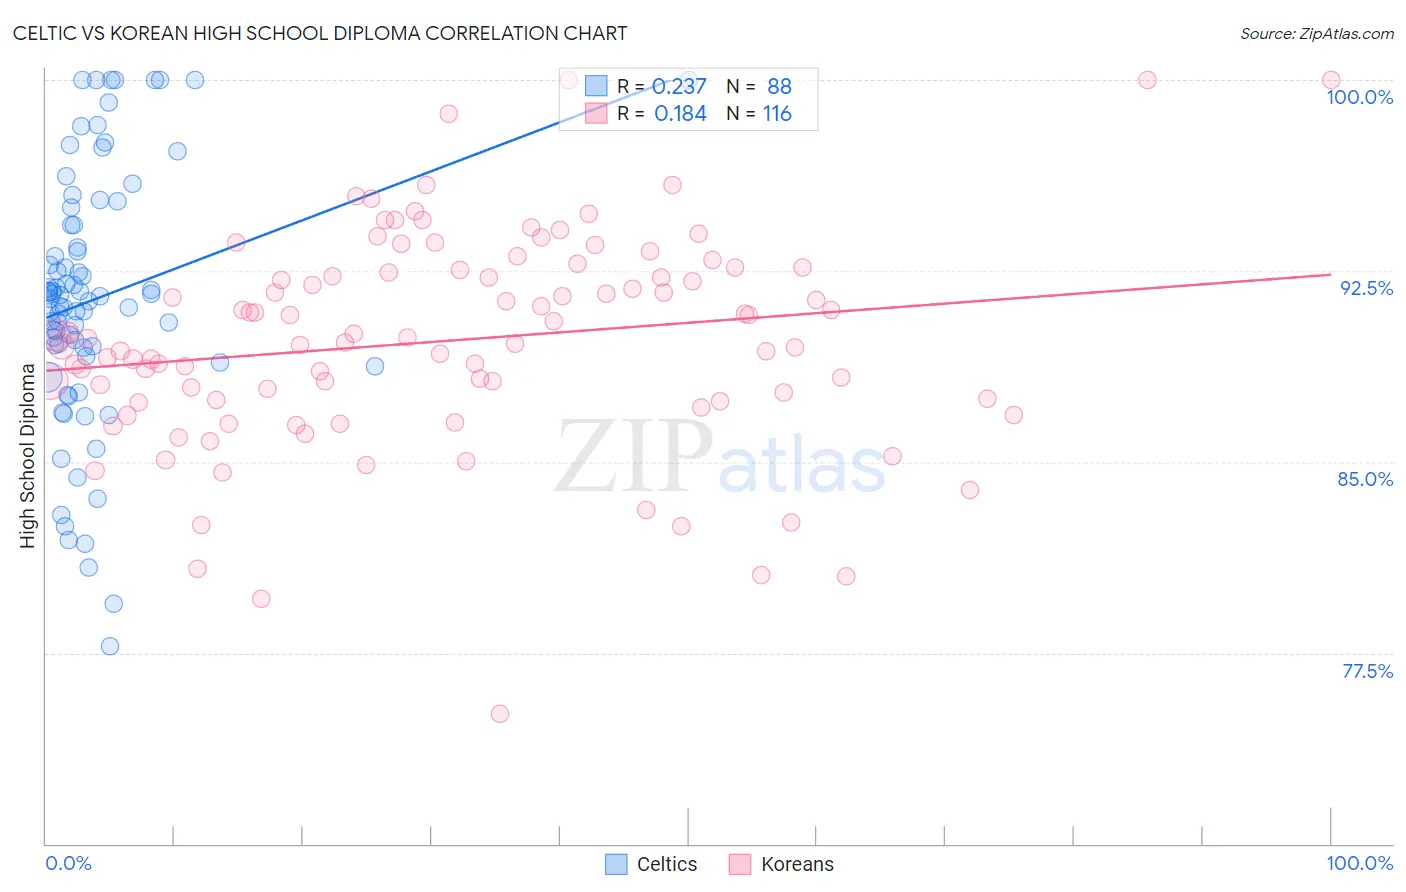
Celtic vs Korean High School Diploma Correlation Chart
The statistical analysis conducted on geographies consisting of 168,876,981 people shows a weak positive correlation between the proportion of Celtics and percentage of population with at least high school diploma education in the United States with a correlation coefficient (R) of 0.237 and weighted average of 90.6%. Similarly, the statistical analysis conducted on geographies consisting of 510,944,198 people shows a poor positive correlation between the proportion of Koreans and percentage of population with at least high school diploma education in the United States with a correlation coefficient (R) of 0.184 and weighted average of 88.6%, a difference of 2.2%.
High School Diploma Correlation Summary
| Measurement | Celtic | Korean |
| Minimum | 77.8% | 75.1% |
| Maximum | 100.0% | 100.0% |
| Range | 22.2% | 24.9% |
| Mean | 91.4% | 89.8% |
| Median | 91.4% | 89.8% |
| Interquartile 25% (IQ1) | 89.3% | 87.4% |
| Interquartile 75% (IQ3) | 94.3% | 92.5% |
| Interquartile Range (IQR) | 5.0% | 5.1% |
| Standard Deviation (Sample) | 5.0% | 4.2% |
| Standard Deviation (Population) | 5.0% | 4.2% |
Similar Demographics by High School Diploma
Demographics Similar to Celtics by High School Diploma
In terms of high school diploma, the demographic groups most similar to Celtics are Canadian (90.6%, a difference of 0.010%), South African (90.6%, a difference of 0.020%), Immigrants from France (90.6%, a difference of 0.030%), Swiss (90.6%, a difference of 0.030%), and Immigrants from Western Europe (90.6%, a difference of 0.040%).
| Demographics | Rating | Rank | High School Diploma |
| Immigrants | Moldova | 99.2 /100 | #83 | Exceptional 90.7% |
| Immigrants | Saudi Arabia | 99.1 /100 | #84 | Exceptional 90.7% |
| Romanians | 98.9 /100 | #85 | Exceptional 90.7% |
| Immigrants | Bulgaria | 98.9 /100 | #86 | Exceptional 90.6% |
| Immigrants | Turkey | 98.9 /100 | #87 | Exceptional 90.6% |
| Immigrants | France | 98.8 /100 | #88 | Exceptional 90.6% |
| Canadians | 98.7 /100 | #89 | Exceptional 90.6% |
| Celtics | 98.7 /100 | #90 | Exceptional 90.6% |
| South Africans | 98.6 /100 | #91 | Exceptional 90.6% |
| Swiss | 98.6 /100 | #92 | Exceptional 90.6% |
| Immigrants | Western Europe | 98.6 /100 | #93 | Exceptional 90.6% |
| Immigrants | Israel | 98.5 /100 | #94 | Exceptional 90.5% |
| Icelanders | 98.5 /100 | #95 | Exceptional 90.5% |
| Immigrants | Serbia | 98.4 /100 | #96 | Exceptional 90.5% |
| Immigrants | Kuwait | 98.3 /100 | #97 | Exceptional 90.5% |
Demographics Similar to Koreans by High School Diploma
In terms of high school diploma, the demographic groups most similar to Koreans are Hawaiian (88.6%, a difference of 0.0%), Panamanian (88.6%, a difference of 0.0%), Marshallese (88.6%, a difference of 0.010%), Liberian (88.7%, a difference of 0.020%), and Somali (88.6%, a difference of 0.020%).
| Demographics | Rating | Rank | High School Diploma |
| Immigrants | Venezuela | 25.8 /100 | #194 | Fair 88.8% |
| Afghans | 23.9 /100 | #195 | Fair 88.8% |
| Immigrants | Southern Europe | 23.4 /100 | #196 | Fair 88.7% |
| French American Indians | 21.5 /100 | #197 | Fair 88.7% |
| Liberians | 18.8 /100 | #198 | Poor 88.7% |
| Marshallese | 18.7 /100 | #199 | Poor 88.6% |
| Hawaiians | 18.3 /100 | #200 | Poor 88.6% |
| Koreans | 18.1 /100 | #201 | Poor 88.6% |
| Panamanians | 18.0 /100 | #202 | Poor 88.6% |
| Somalis | 17.5 /100 | #203 | Poor 88.6% |
| Armenians | 17.2 /100 | #204 | Poor 88.6% |
| Immigrants | Micronesia | 16.4 /100 | #205 | Poor 88.6% |
| Arapaho | 16.1 /100 | #206 | Poor 88.6% |
| Immigrants | Sierra Leone | 15.8 /100 | #207 | Poor 88.6% |
| Portuguese | 14.4 /100 | #208 | Poor 88.5% |