Celtic vs Guatemalan High School Diploma
COMPARE
Celtic
Guatemalan
High School Diploma
High School Diploma Comparison
Celtics
Guatemalans
90.6%
HIGH SCHOOL DIPLOMA
98.7/ 100
METRIC RATING
90th/ 347
METRIC RANK
82.0%
HIGH SCHOOL DIPLOMA
0.0/ 100
METRIC RATING
335th/ 347
METRIC RANK
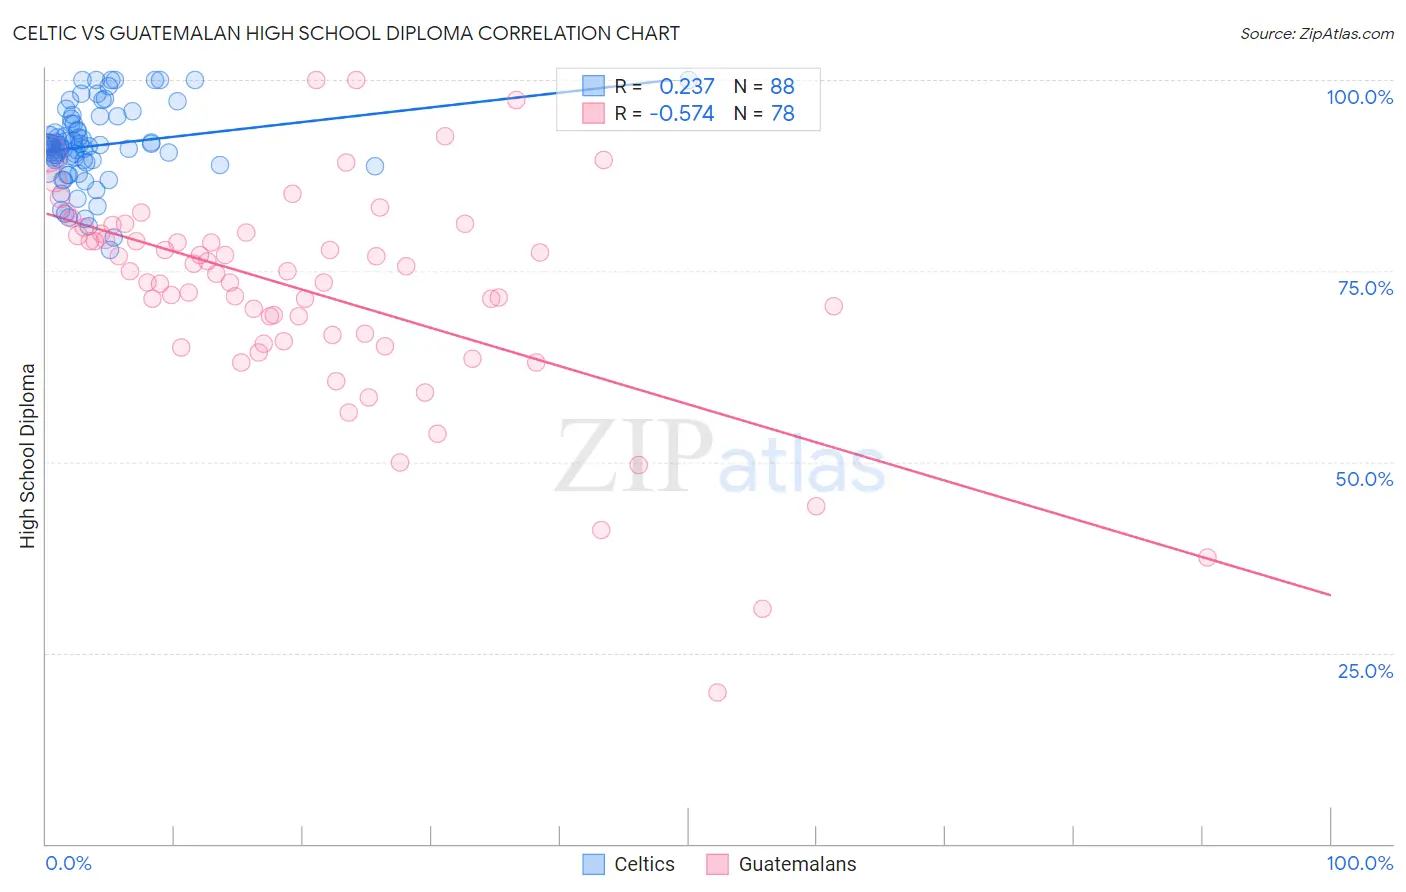
Celtic vs Guatemalan High School Diploma Correlation Chart
The statistical analysis conducted on geographies consisting of 168,876,981 people shows a weak positive correlation between the proportion of Celtics and percentage of population with at least high school diploma education in the United States with a correlation coefficient (R) of 0.237 and weighted average of 90.6%. Similarly, the statistical analysis conducted on geographies consisting of 409,566,541 people shows a substantial negative correlation between the proportion of Guatemalans and percentage of population with at least high school diploma education in the United States with a correlation coefficient (R) of -0.574 and weighted average of 82.0%, a difference of 10.5%.
High School Diploma Correlation Summary
| Measurement | Celtic | Guatemalan |
| Minimum | 77.8% | 19.8% |
| Maximum | 100.0% | 100.0% |
| Range | 22.2% | 80.2% |
| Mean | 91.4% | 72.2% |
| Median | 91.4% | 74.8% |
| Interquartile 25% (IQ1) | 89.3% | 65.9% |
| Interquartile 75% (IQ3) | 94.3% | 79.9% |
| Interquartile Range (IQR) | 5.0% | 14.1% |
| Standard Deviation (Sample) | 5.0% | 14.2% |
| Standard Deviation (Population) | 5.0% | 14.1% |
Similar Demographics by High School Diploma
Demographics Similar to Celtics by High School Diploma
In terms of high school diploma, the demographic groups most similar to Celtics are Canadian (90.6%, a difference of 0.010%), South African (90.6%, a difference of 0.020%), Immigrants from France (90.6%, a difference of 0.030%), Swiss (90.6%, a difference of 0.030%), and Immigrants from Western Europe (90.6%, a difference of 0.040%).
| Demographics | Rating | Rank | High School Diploma |
| Immigrants | Moldova | 99.2 /100 | #83 | Exceptional 90.7% |
| Immigrants | Saudi Arabia | 99.1 /100 | #84 | Exceptional 90.7% |
| Romanians | 98.9 /100 | #85 | Exceptional 90.7% |
| Immigrants | Bulgaria | 98.9 /100 | #86 | Exceptional 90.6% |
| Immigrants | Turkey | 98.9 /100 | #87 | Exceptional 90.6% |
| Immigrants | France | 98.8 /100 | #88 | Exceptional 90.6% |
| Canadians | 98.7 /100 | #89 | Exceptional 90.6% |
| Celtics | 98.7 /100 | #90 | Exceptional 90.6% |
| South Africans | 98.6 /100 | #91 | Exceptional 90.6% |
| Swiss | 98.6 /100 | #92 | Exceptional 90.6% |
| Immigrants | Western Europe | 98.6 /100 | #93 | Exceptional 90.6% |
| Immigrants | Israel | 98.5 /100 | #94 | Exceptional 90.5% |
| Icelanders | 98.5 /100 | #95 | Exceptional 90.5% |
| Immigrants | Serbia | 98.4 /100 | #96 | Exceptional 90.5% |
| Immigrants | Kuwait | 98.3 /100 | #97 | Exceptional 90.5% |
Demographics Similar to Guatemalans by High School Diploma
In terms of high school diploma, the demographic groups most similar to Guatemalans are Immigrants from Dominican Republic (82.0%, a difference of 0.010%), Tohono O'odham (82.1%, a difference of 0.11%), Immigrants from Yemen (81.8%, a difference of 0.15%), Immigrants from Latin America (82.1%, a difference of 0.22%), and Salvadoran (81.7%, a difference of 0.33%).
| Demographics | Rating | Rank | High School Diploma |
| Dominicans | 0.0 /100 | #328 | Tragic 82.9% |
| Hispanics or Latinos | 0.0 /100 | #329 | Tragic 82.9% |
| Immigrants | Azores | 0.0 /100 | #330 | Tragic 82.8% |
| Central Americans | 0.0 /100 | #331 | Tragic 82.5% |
| Immigrants | Honduras | 0.0 /100 | #332 | Tragic 82.5% |
| Immigrants | Latin America | 0.0 /100 | #333 | Tragic 82.1% |
| Tohono O'odham | 0.0 /100 | #334 | Tragic 82.1% |
| Guatemalans | 0.0 /100 | #335 | Tragic 82.0% |
| Immigrants | Dominican Republic | 0.0 /100 | #336 | Tragic 82.0% |
| Immigrants | Yemen | 0.0 /100 | #337 | Tragic 81.8% |
| Salvadorans | 0.0 /100 | #338 | Tragic 81.7% |
| Pima | 0.0 /100 | #339 | Tragic 81.6% |
| Houma | 0.0 /100 | #340 | Tragic 81.5% |
| Mexicans | 0.0 /100 | #341 | Tragic 81.4% |
| Immigrants | Guatemala | 0.0 /100 | #342 | Tragic 81.4% |