Immigrants from South America vs Immigrants from Portugal High School Diploma
COMPARE
Immigrants from South America
Immigrants from Portugal
High School Diploma
High School Diploma Comparison
Immigrants from South America
Immigrants from Portugal
87.6%
HIGH SCHOOL DIPLOMA
1.2/ 100
METRIC RATING
252nd/ 347
METRIC RANK
85.3%
HIGH SCHOOL DIPLOMA
0.0/ 100
METRIC RATING
305th/ 347
METRIC RANK
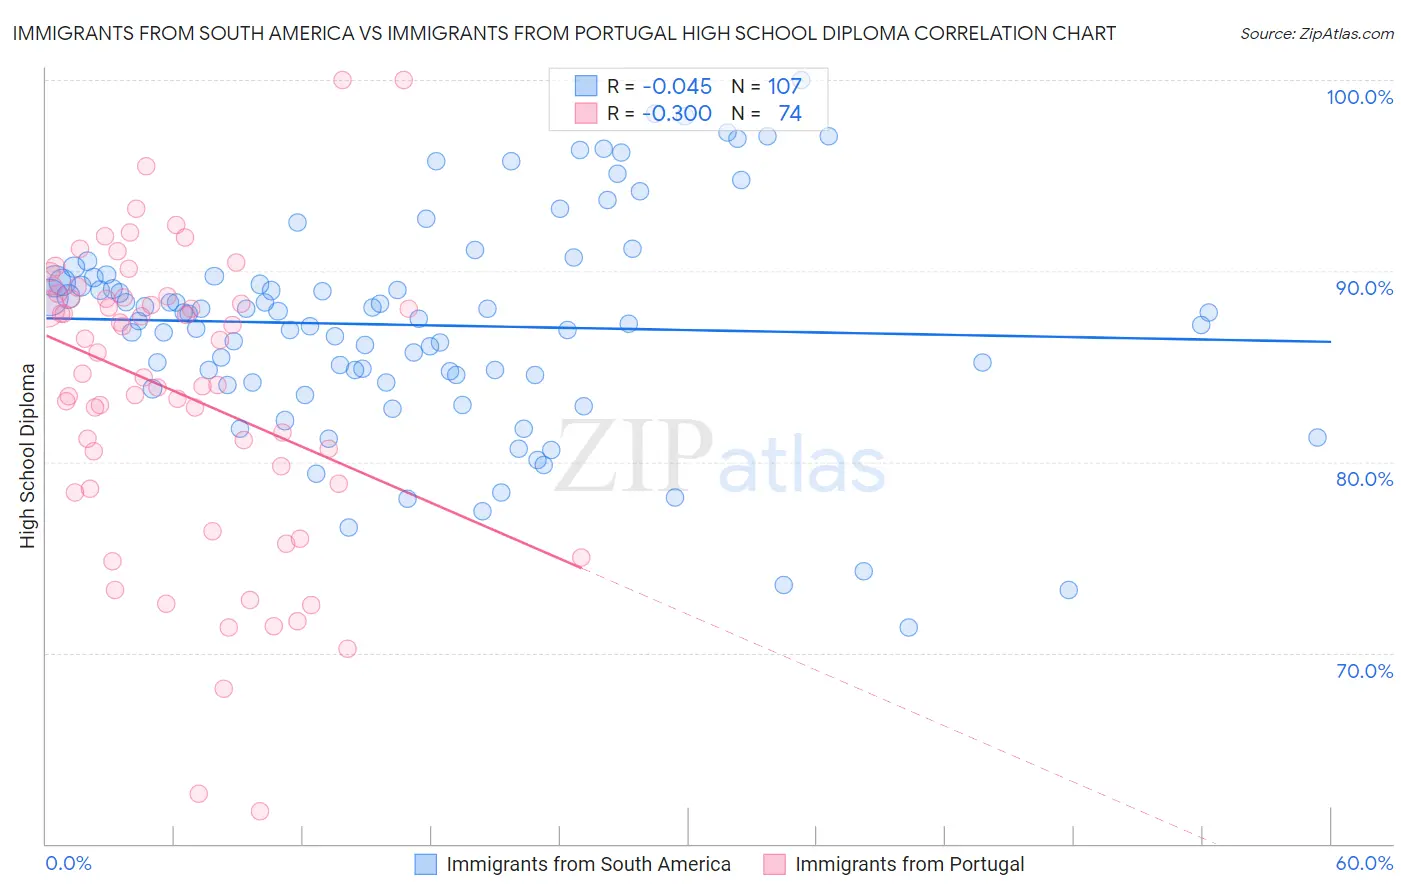
Immigrants from South America vs Immigrants from Portugal High School Diploma Correlation Chart
The statistical analysis conducted on geographies consisting of 486,312,594 people shows no correlation between the proportion of Immigrants from South America and percentage of population with at least high school diploma education in the United States with a correlation coefficient (R) of -0.045 and weighted average of 87.6%. Similarly, the statistical analysis conducted on geographies consisting of 174,792,669 people shows a mild negative correlation between the proportion of Immigrants from Portugal and percentage of population with at least high school diploma education in the United States with a correlation coefficient (R) of -0.300 and weighted average of 85.3%, a difference of 2.7%.
High School Diploma Correlation Summary
| Measurement | Immigrants from South America | Immigrants from Portugal |
| Minimum | 71.3% | 61.7% |
| Maximum | 100.0% | 100.0% |
| Range | 28.7% | 38.3% |
| Mean | 87.2% | 83.7% |
| Median | 87.5% | 85.2% |
| Interquartile 25% (IQ1) | 84.2% | 78.9% |
| Interquartile 75% (IQ3) | 89.7% | 88.6% |
| Interquartile Range (IQR) | 5.5% | 9.8% |
| Standard Deviation (Sample) | 5.7% | 7.8% |
| Standard Deviation (Population) | 5.7% | 7.8% |
Similar Demographics by High School Diploma
Demographics Similar to Immigrants from South America by High School Diploma
In terms of high school diploma, the demographic groups most similar to Immigrants from South America are Immigrants from Uruguay (87.6%, a difference of 0.050%), Immigrants from Colombia (87.6%, a difference of 0.050%), Ghanaian (87.7%, a difference of 0.060%), Senegalese (87.7%, a difference of 0.10%), and Immigrants from Nigeria (87.7%, a difference of 0.10%).
| Demographics | Rating | Rank | High School Diploma |
| Peruvians | 1.9 /100 | #245 | Tragic 87.8% |
| Immigrants | Eritrea | 1.7 /100 | #246 | Tragic 87.8% |
| Immigrants | Costa Rica | 1.7 /100 | #247 | Tragic 87.8% |
| Spanish Americans | 1.5 /100 | #248 | Tragic 87.7% |
| Senegalese | 1.5 /100 | #249 | Tragic 87.7% |
| Immigrants | Nigeria | 1.5 /100 | #250 | Tragic 87.7% |
| Ghanaians | 1.4 /100 | #251 | Tragic 87.7% |
| Immigrants | South America | 1.2 /100 | #252 | Tragic 87.6% |
| Immigrants | Uruguay | 1.0 /100 | #253 | Tragic 87.6% |
| Immigrants | Colombia | 1.0 /100 | #254 | Tragic 87.6% |
| Immigrants | Senegal | 0.9 /100 | #255 | Tragic 87.6% |
| Africans | 0.7 /100 | #256 | Tragic 87.5% |
| Bahamians | 0.7 /100 | #257 | Tragic 87.5% |
| Immigrants | Ghana | 0.5 /100 | #258 | Tragic 87.4% |
| Immigrants | Western Africa | 0.5 /100 | #259 | Tragic 87.4% |
Demographics Similar to Immigrants from Portugal by High School Diploma
In terms of high school diploma, the demographic groups most similar to Immigrants from Portugal are Nepalese (85.3%, a difference of 0.010%), Immigrants from Guyana (85.3%, a difference of 0.050%), Immigrants from Haiti (85.4%, a difference of 0.11%), Cuban (85.4%, a difference of 0.11%), and Navajo (85.2%, a difference of 0.14%).
| Demographics | Rating | Rank | High School Diploma |
| Natives/Alaskans | 0.0 /100 | #298 | Tragic 85.6% |
| Guyanese | 0.0 /100 | #299 | Tragic 85.5% |
| Immigrants | Bangladesh | 0.0 /100 | #300 | Tragic 85.5% |
| Vietnamese | 0.0 /100 | #301 | Tragic 85.4% |
| Immigrants | Haiti | 0.0 /100 | #302 | Tragic 85.4% |
| Cubans | 0.0 /100 | #303 | Tragic 85.4% |
| Nepalese | 0.0 /100 | #304 | Tragic 85.3% |
| Immigrants | Portugal | 0.0 /100 | #305 | Tragic 85.3% |
| Immigrants | Guyana | 0.0 /100 | #306 | Tragic 85.3% |
| Navajo | 0.0 /100 | #307 | Tragic 85.2% |
| Immigrants | Armenia | 0.0 /100 | #308 | Tragic 85.2% |
| Immigrants | Dominica | 0.0 /100 | #309 | Tragic 85.2% |
| Apache | 0.0 /100 | #310 | Tragic 85.1% |
| Ecuadorians | 0.0 /100 | #311 | Tragic 85.1% |
| Cape Verdeans | 0.0 /100 | #312 | Tragic 85.1% |