Celtic vs Dutch West Indian 10th Grade
COMPARE
Celtic
Dutch West Indian
10th Grade
10th Grade Comparison
Celtics
Dutch West Indians
95.0%
10TH GRADE
99.8/ 100
METRIC RATING
59th/ 347
METRIC RANK
92.6%
10TH GRADE
0.4/ 100
METRIC RATING
265th/ 347
METRIC RANK
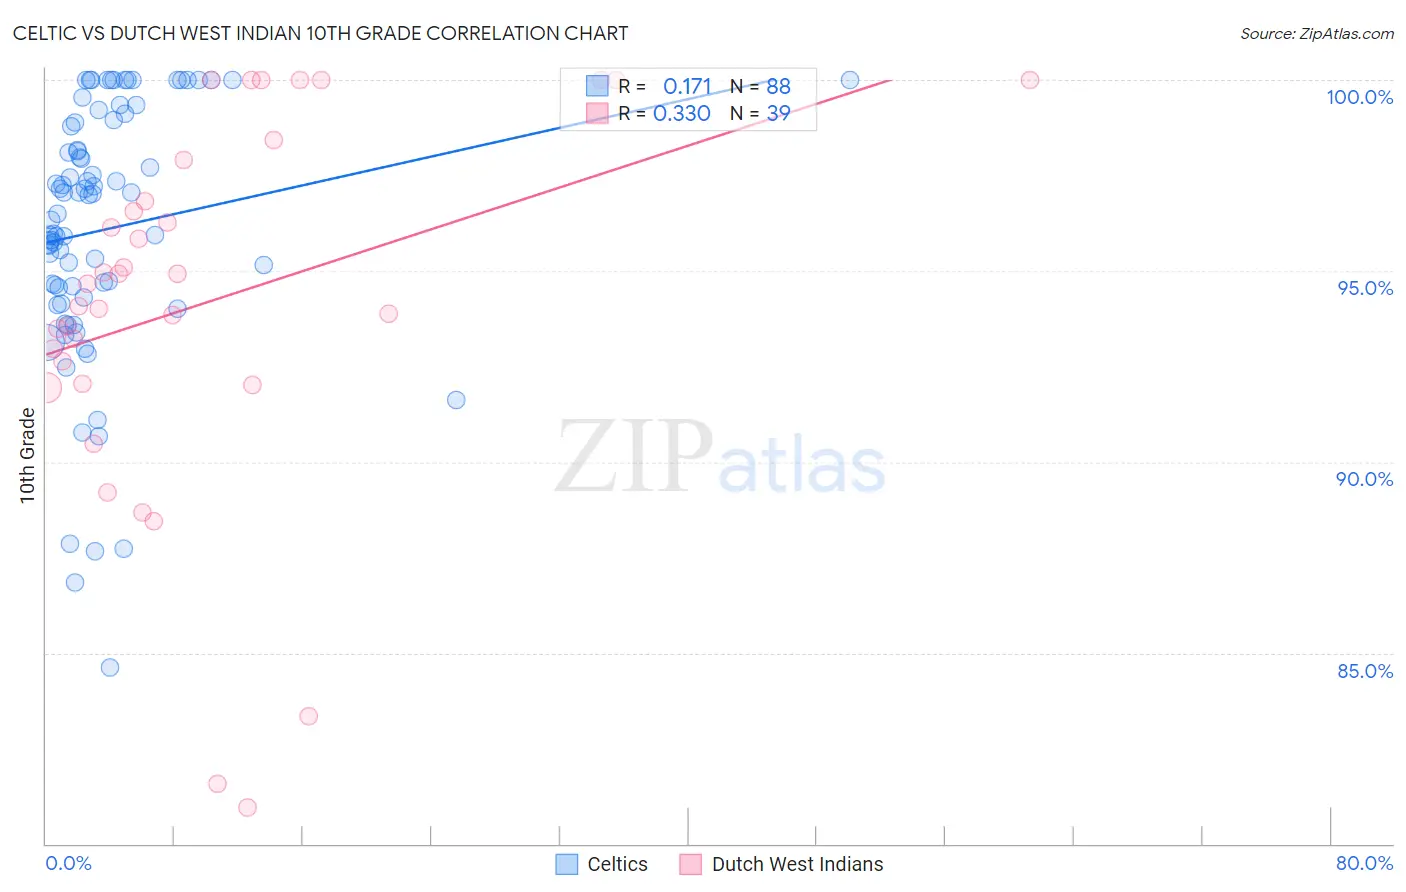
Celtic vs Dutch West Indian 10th Grade Correlation Chart
The statistical analysis conducted on geographies consisting of 168,876,981 people shows a poor positive correlation between the proportion of Celtics and percentage of population with at least 10th grade education in the United States with a correlation coefficient (R) of 0.171 and weighted average of 95.0%. Similarly, the statistical analysis conducted on geographies consisting of 85,776,122 people shows a mild positive correlation between the proportion of Dutch West Indians and percentage of population with at least 10th grade education in the United States with a correlation coefficient (R) of 0.330 and weighted average of 92.6%, a difference of 2.6%.
10th Grade Correlation Summary
| Measurement | Celtic | Dutch West Indian |
| Minimum | 84.6% | 81.0% |
| Maximum | 100.0% | 100.0% |
| Range | 15.4% | 19.0% |
| Mean | 96.1% | 94.2% |
| Median | 96.8% | 94.7% |
| Interquartile 25% (IQ1) | 94.4% | 92.0% |
| Interquartile 75% (IQ3) | 98.9% | 97.9% |
| Interquartile Range (IQR) | 4.5% | 5.9% |
| Standard Deviation (Sample) | 3.4% | 4.9% |
| Standard Deviation (Population) | 3.4% | 4.8% |
Similar Demographics by 10th Grade
Demographics Similar to Celtics by 10th Grade
In terms of 10th grade, the demographic groups most similar to Celtics are Aleut (95.0%, a difference of 0.0%), Immigrants from Ireland (95.0%, a difference of 0.010%), New Zealander (95.0%, a difference of 0.010%), Ukrainian (95.0%, a difference of 0.010%), and Cypriot (95.0%, a difference of 0.010%).
| Demographics | Rating | Rank | 10th Grade |
| Ottawa | 99.8 /100 | #52 | Exceptional 95.1% |
| Immigrants | North America | 99.8 /100 | #53 | Exceptional 95.0% |
| Immigrants | Lithuania | 99.8 /100 | #54 | Exceptional 95.0% |
| Immigrants | Ireland | 99.8 /100 | #55 | Exceptional 95.0% |
| New Zealanders | 99.8 /100 | #56 | Exceptional 95.0% |
| Ukrainians | 99.8 /100 | #57 | Exceptional 95.0% |
| Aleuts | 99.8 /100 | #58 | Exceptional 95.0% |
| Celtics | 99.8 /100 | #59 | Exceptional 95.0% |
| Cypriots | 99.8 /100 | #60 | Exceptional 95.0% |
| Chippewa | 99.8 /100 | #61 | Exceptional 95.0% |
| Thais | 99.8 /100 | #62 | Exceptional 95.0% |
| Immigrants | Singapore | 99.8 /100 | #63 | Exceptional 95.0% |
| Native Hawaiians | 99.7 /100 | #64 | Exceptional 95.0% |
| Turks | 99.7 /100 | #65 | Exceptional 95.0% |
| Immigrants | Australia | 99.7 /100 | #66 | Exceptional 94.9% |
Demographics Similar to Dutch West Indians by 10th Grade
In terms of 10th grade, the demographic groups most similar to Dutch West Indians are Immigrants from Philippines (92.6%, a difference of 0.0%), Taiwanese (92.5%, a difference of 0.010%), Immigrants from Ghana (92.5%, a difference of 0.010%), Immigrants from South America (92.6%, a difference of 0.030%), and Apache (92.6%, a difference of 0.030%).
| Demographics | Rating | Rank | 10th Grade |
| Immigrants | Costa Rica | 0.6 /100 | #258 | Tragic 92.7% |
| Immigrants | Jamaica | 0.5 /100 | #259 | Tragic 92.6% |
| Immigrants | Uzbekistan | 0.5 /100 | #260 | Tragic 92.6% |
| Paiute | 0.4 /100 | #261 | Tragic 92.6% |
| Immigrants | South America | 0.4 /100 | #262 | Tragic 92.6% |
| Apache | 0.4 /100 | #263 | Tragic 92.6% |
| Peruvians | 0.4 /100 | #264 | Tragic 92.6% |
| Dutch West Indians | 0.4 /100 | #265 | Tragic 92.6% |
| Immigrants | Philippines | 0.4 /100 | #266 | Tragic 92.6% |
| Taiwanese | 0.3 /100 | #267 | Tragic 92.5% |
| Immigrants | Ghana | 0.3 /100 | #268 | Tragic 92.5% |
| Immigrants | Colombia | 0.3 /100 | #269 | Tragic 92.5% |
| Immigrants | Uruguay | 0.3 /100 | #270 | Tragic 92.5% |
| Immigrants | Eritrea | 0.3 /100 | #271 | Tragic 92.5% |
| Immigrants | Western Africa | 0.3 /100 | #272 | Tragic 92.5% |