Slovak vs Immigrants from India 10th Grade
COMPARE
Slovak
Immigrants from India
10th Grade
10th Grade Comparison
Slovaks
Immigrants from India
96.0%
10TH GRADE
100.0/ 100
METRIC RATING
2nd/ 347
METRIC RANK
95.3%
10TH GRADE
99.9/ 100
METRIC RATING
36th/ 347
METRIC RANK
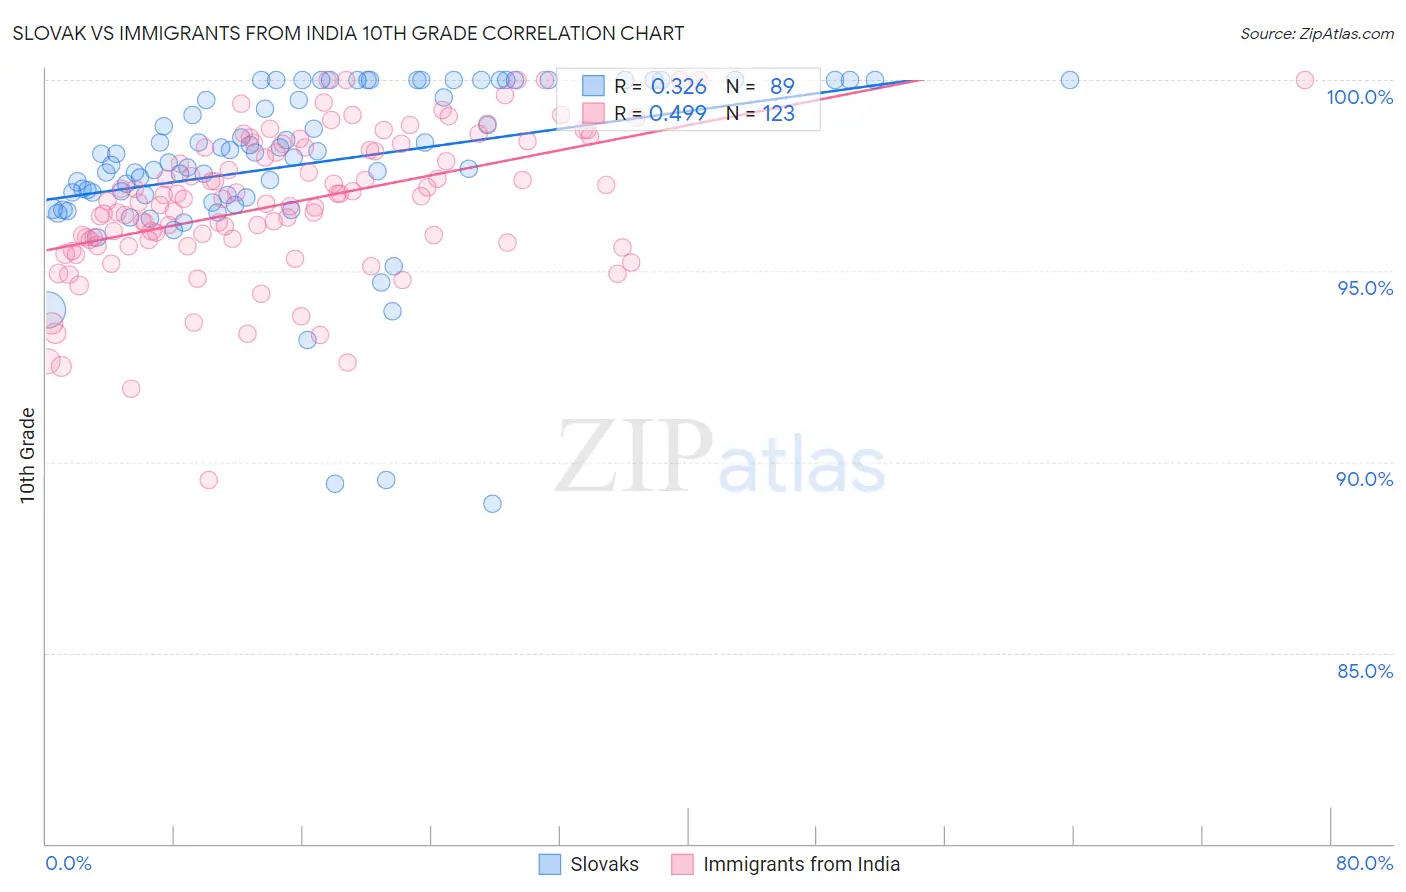
Slovak vs Immigrants from India 10th Grade Correlation Chart
The statistical analysis conducted on geographies consisting of 397,891,887 people shows a mild positive correlation between the proportion of Slovaks and percentage of population with at least 10th grade education in the United States with a correlation coefficient (R) of 0.326 and weighted average of 96.0%. Similarly, the statistical analysis conducted on geographies consisting of 434,105,844 people shows a moderate positive correlation between the proportion of Immigrants from India and percentage of population with at least 10th grade education in the United States with a correlation coefficient (R) of 0.499 and weighted average of 95.3%, a difference of 0.78%.
10th Grade Correlation Summary
| Measurement | Slovak | Immigrants from India |
| Minimum | 88.9% | 89.5% |
| Maximum | 100.0% | 100.0% |
| Range | 11.1% | 10.5% |
| Mean | 97.8% | 96.8% |
| Median | 98.1% | 96.9% |
| Interquartile 25% (IQ1) | 97.0% | 95.8% |
| Interquartile 75% (IQ3) | 100.0% | 98.3% |
| Interquartile Range (IQR) | 3.0% | 2.5% |
| Standard Deviation (Sample) | 2.3% | 1.9% |
| Standard Deviation (Population) | 2.2% | 1.9% |
Similar Demographics by 10th Grade
Demographics Similar to Slovaks by 10th Grade
In terms of 10th grade, the demographic groups most similar to Slovaks are Slovene (95.9%, a difference of 0.10%), Swedish (95.9%, a difference of 0.10%), Carpatho Rusyn (95.9%, a difference of 0.12%), Norwegian (96.2%, a difference of 0.13%), and Polish (95.8%, a difference of 0.23%).
| Demographics | Rating | Rank | 10th Grade |
| Norwegians | 100.0 /100 | #1 | Exceptional 96.2% |
| Slovaks | 100.0 /100 | #2 | Exceptional 96.0% |
| Slovenes | 100.0 /100 | #3 | Exceptional 95.9% |
| Swedes | 100.0 /100 | #4 | Exceptional 95.9% |
| Carpatho Rusyns | 100.0 /100 | #5 | Exceptional 95.9% |
| Poles | 100.0 /100 | #6 | Exceptional 95.8% |
| Germans | 100.0 /100 | #7 | Exceptional 95.8% |
| Lithuanians | 100.0 /100 | #8 | Exceptional 95.8% |
| Finns | 100.0 /100 | #9 | Exceptional 95.8% |
| Croatians | 100.0 /100 | #10 | Exceptional 95.7% |
| Danes | 100.0 /100 | #11 | Exceptional 95.7% |
| Tlingit-Haida | 100.0 /100 | #12 | Exceptional 95.7% |
| English | 100.0 /100 | #13 | Exceptional 95.6% |
| Tsimshian | 100.0 /100 | #14 | Exceptional 95.6% |
| Irish | 100.0 /100 | #15 | Exceptional 95.6% |
Demographics Similar to Immigrants from India by 10th Grade
In terms of 10th grade, the demographic groups most similar to Immigrants from India are Estonian (95.3%, a difference of 0.010%), Hungarian (95.3%, a difference of 0.020%), French (95.3%, a difference of 0.020%), British (95.3%, a difference of 0.020%), and French Canadian (95.3%, a difference of 0.020%).
| Demographics | Rating | Rank | 10th Grade |
| Bulgarians | 100.0 /100 | #29 | Exceptional 95.4% |
| Belgians | 100.0 /100 | #30 | Exceptional 95.4% |
| Iranians | 100.0 /100 | #31 | Exceptional 95.3% |
| Hungarians | 100.0 /100 | #32 | Exceptional 95.3% |
| French | 100.0 /100 | #33 | Exceptional 95.3% |
| British | 99.9 /100 | #34 | Exceptional 95.3% |
| Estonians | 99.9 /100 | #35 | Exceptional 95.3% |
| Immigrants | India | 99.9 /100 | #36 | Exceptional 95.3% |
| French Canadians | 99.9 /100 | #37 | Exceptional 95.3% |
| Northern Europeans | 99.9 /100 | #38 | Exceptional 95.3% |
| Immigrants | Scotland | 99.9 /100 | #39 | Exceptional 95.2% |
| Scotch-Irish | 99.9 /100 | #40 | Exceptional 95.2% |
| Russians | 99.9 /100 | #41 | Exceptional 95.2% |
| Slavs | 99.9 /100 | #42 | Exceptional 95.2% |
| Macedonians | 99.9 /100 | #43 | Exceptional 95.2% |