Celtic vs Immigrants from Burma/Myanmar 10th Grade
COMPARE
Celtic
Immigrants from Burma/Myanmar
10th Grade
10th Grade Comparison
Celtics
Immigrants from Burma/Myanmar
95.0%
10TH GRADE
99.8/ 100
METRIC RATING
59th/ 347
METRIC RANK
91.8%
10TH GRADE
0.0/ 100
METRIC RATING
292nd/ 347
METRIC RANK
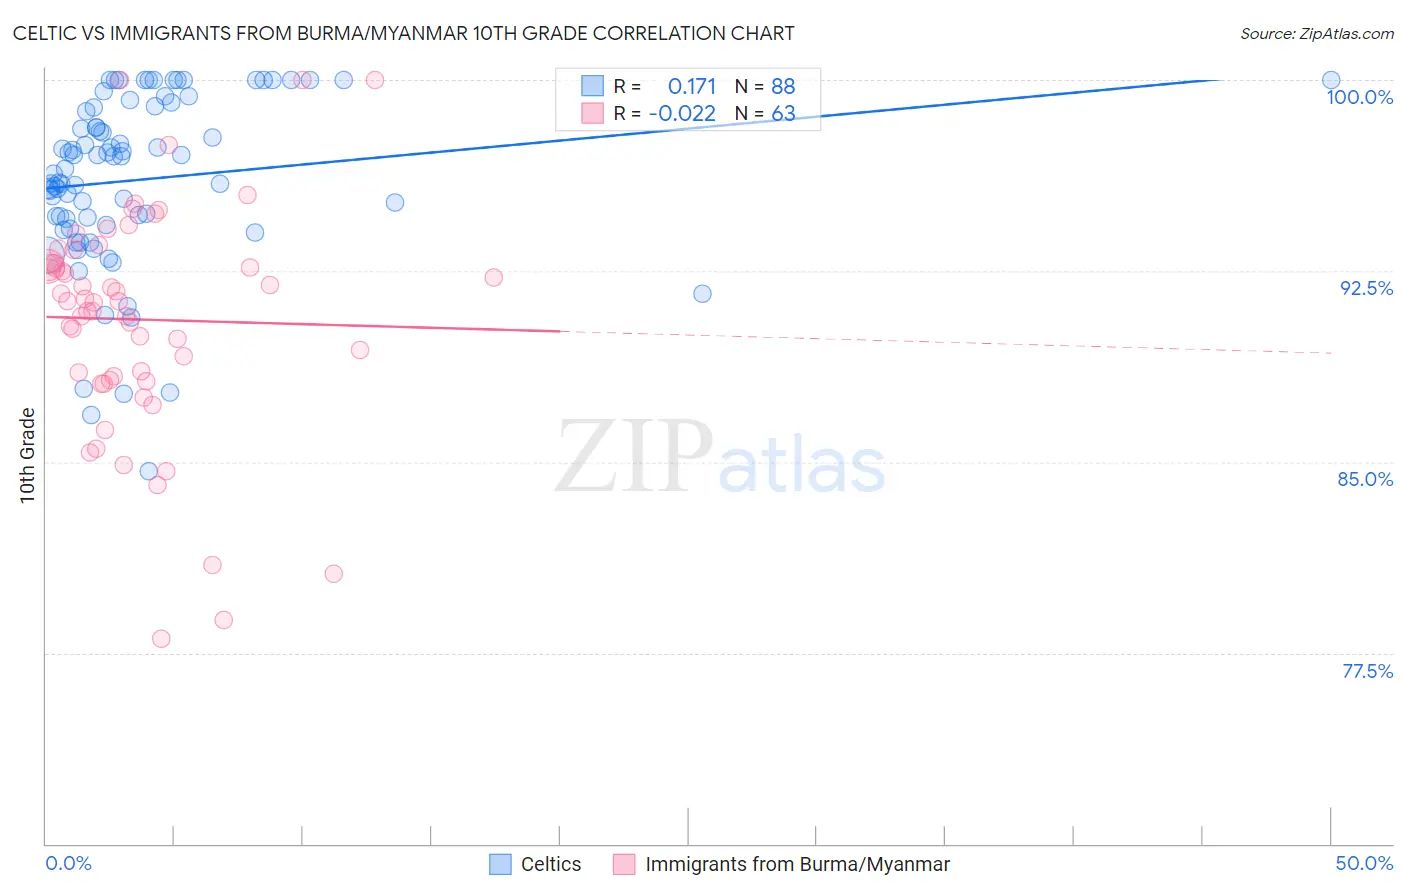
Celtic vs Immigrants from Burma/Myanmar 10th Grade Correlation Chart
The statistical analysis conducted on geographies consisting of 168,876,981 people shows a poor positive correlation between the proportion of Celtics and percentage of population with at least 10th grade education in the United States with a correlation coefficient (R) of 0.171 and weighted average of 95.0%. Similarly, the statistical analysis conducted on geographies consisting of 172,345,696 people shows no correlation between the proportion of Immigrants from Burma/Myanmar and percentage of population with at least 10th grade education in the United States with a correlation coefficient (R) of -0.022 and weighted average of 91.8%, a difference of 3.5%.
10th Grade Correlation Summary
| Measurement | Celtic | Immigrants from Burma/Myanmar |
| Minimum | 84.6% | 78.1% |
| Maximum | 100.0% | 100.0% |
| Range | 15.4% | 21.9% |
| Mean | 96.1% | 90.6% |
| Median | 96.8% | 91.3% |
| Interquartile 25% (IQ1) | 94.4% | 88.2% |
| Interquartile 75% (IQ3) | 98.9% | 92.8% |
| Interquartile Range (IQR) | 4.5% | 4.6% |
| Standard Deviation (Sample) | 3.4% | 4.5% |
| Standard Deviation (Population) | 3.4% | 4.5% |
Similar Demographics by 10th Grade
Demographics Similar to Celtics by 10th Grade
In terms of 10th grade, the demographic groups most similar to Celtics are Aleut (95.0%, a difference of 0.0%), Immigrants from Ireland (95.0%, a difference of 0.010%), New Zealander (95.0%, a difference of 0.010%), Ukrainian (95.0%, a difference of 0.010%), and Cypriot (95.0%, a difference of 0.010%).
| Demographics | Rating | Rank | 10th Grade |
| Ottawa | 99.8 /100 | #52 | Exceptional 95.1% |
| Immigrants | North America | 99.8 /100 | #53 | Exceptional 95.0% |
| Immigrants | Lithuania | 99.8 /100 | #54 | Exceptional 95.0% |
| Immigrants | Ireland | 99.8 /100 | #55 | Exceptional 95.0% |
| New Zealanders | 99.8 /100 | #56 | Exceptional 95.0% |
| Ukrainians | 99.8 /100 | #57 | Exceptional 95.0% |
| Aleuts | 99.8 /100 | #58 | Exceptional 95.0% |
| Celtics | 99.8 /100 | #59 | Exceptional 95.0% |
| Cypriots | 99.8 /100 | #60 | Exceptional 95.0% |
| Chippewa | 99.8 /100 | #61 | Exceptional 95.0% |
| Thais | 99.8 /100 | #62 | Exceptional 95.0% |
| Immigrants | Singapore | 99.8 /100 | #63 | Exceptional 95.0% |
| Native Hawaiians | 99.7 /100 | #64 | Exceptional 95.0% |
| Turks | 99.7 /100 | #65 | Exceptional 95.0% |
| Immigrants | Australia | 99.7 /100 | #66 | Exceptional 94.9% |
Demographics Similar to Immigrants from Burma/Myanmar by 10th Grade
In terms of 10th grade, the demographic groups most similar to Immigrants from Burma/Myanmar are Immigrants from West Indies (91.8%, a difference of 0.0%), British West Indian (91.8%, a difference of 0.010%), Indonesian (91.8%, a difference of 0.020%), Sri Lankan (91.8%, a difference of 0.030%), and Haitian (91.8%, a difference of 0.050%).
| Demographics | Rating | Rank | 10th Grade |
| Immigrants | South Eastern Asia | 0.0 /100 | #285 | Tragic 92.1% |
| Yuman | 0.0 /100 | #286 | Tragic 92.0% |
| Pennsylvania Germans | 0.0 /100 | #287 | Tragic 91.9% |
| Immigrants | Laos | 0.0 /100 | #288 | Tragic 91.9% |
| Sri Lankans | 0.0 /100 | #289 | Tragic 91.8% |
| British West Indians | 0.0 /100 | #290 | Tragic 91.8% |
| Immigrants | West Indies | 0.0 /100 | #291 | Tragic 91.8% |
| Immigrants | Burma/Myanmar | 0.0 /100 | #292 | Tragic 91.8% |
| Indonesians | 0.0 /100 | #293 | Tragic 91.8% |
| Haitians | 0.0 /100 | #294 | Tragic 91.8% |
| Lumbee | 0.0 /100 | #295 | Tragic 91.7% |
| Immigrants | Grenada | 0.0 /100 | #296 | Tragic 91.6% |
| Fijians | 0.0 /100 | #297 | Tragic 91.5% |
| Cubans | 0.0 /100 | #298 | Tragic 91.5% |
| Immigrants | Haiti | 0.0 /100 | #299 | Tragic 91.4% |