Celtic vs Immigrants from Burma/Myanmar Householder Income Ages 25 - 44 years
COMPARE
Celtic
Immigrants from Burma/Myanmar
Householder Income Ages 25 - 44 years
Householder Income Ages 25 - 44 years Comparison
Celtics
Immigrants from Burma/Myanmar
$92,241
HOUSEHOLDER INCOME AGES 25 - 44 YEARS
21.6/ 100
METRIC RATING
195th/ 347
METRIC RANK
$86,736
HOUSEHOLDER INCOME AGES 25 - 44 YEARS
1.3/ 100
METRIC RATING
246th/ 347
METRIC RANK
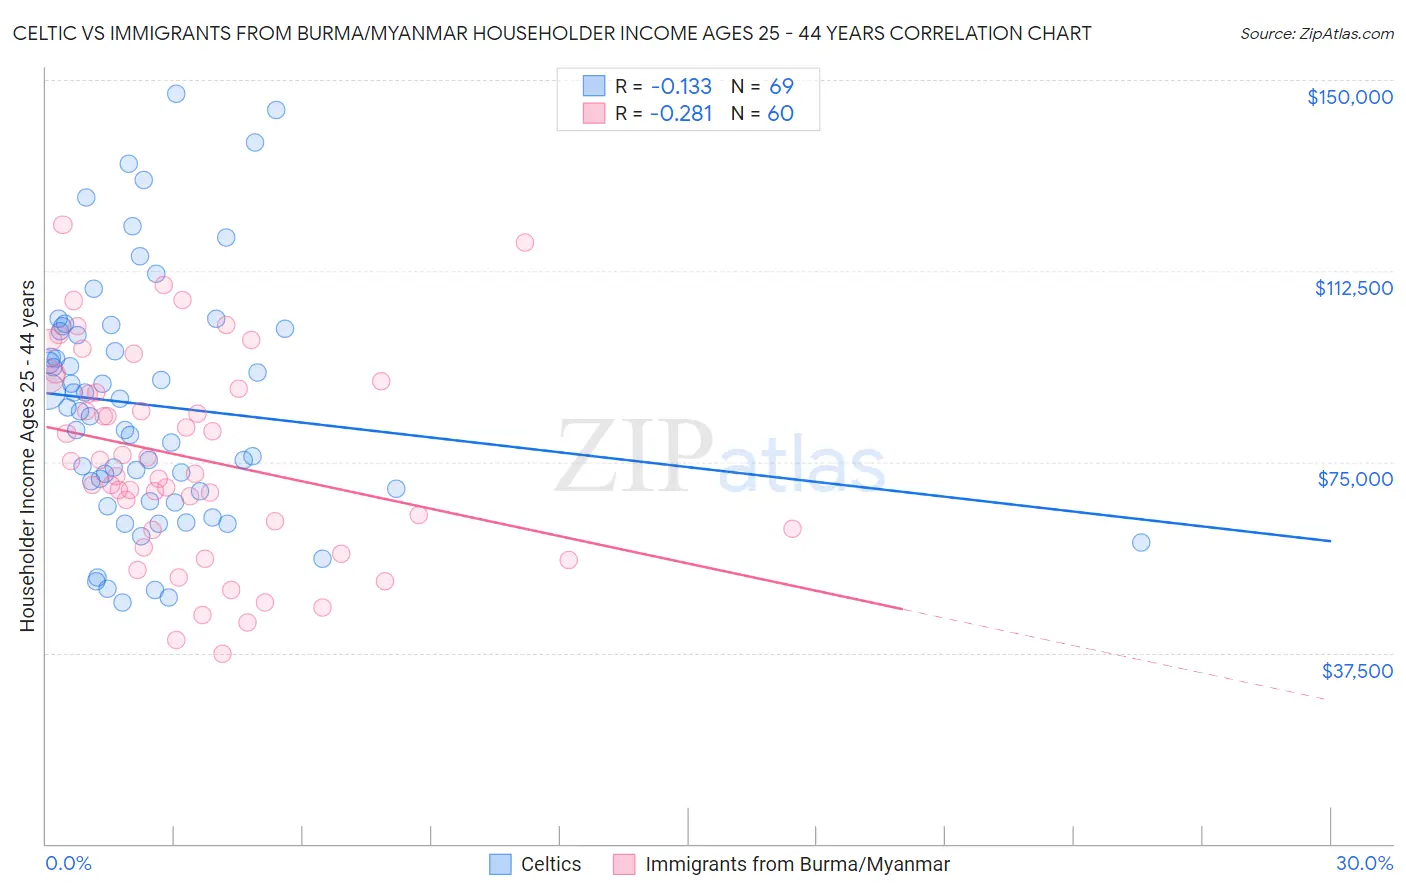
Celtic vs Immigrants from Burma/Myanmar Householder Income Ages 25 - 44 years Correlation Chart
The statistical analysis conducted on geographies consisting of 168,638,576 people shows a poor negative correlation between the proportion of Celtics and household income with householder between the ages 25 and 44 in the United States with a correlation coefficient (R) of -0.133 and weighted average of $92,241. Similarly, the statistical analysis conducted on geographies consisting of 172,191,155 people shows a weak negative correlation between the proportion of Immigrants from Burma/Myanmar and household income with householder between the ages 25 and 44 in the United States with a correlation coefficient (R) of -0.281 and weighted average of $86,736, a difference of 6.4%.
Householder Income Ages 25 - 44 years Correlation Summary
| Measurement | Celtic | Immigrants from Burma/Myanmar |
| Minimum | $47,456 | $37,365 |
| Maximum | $147,258 | $121,540 |
| Range | $99,801 | $84,175 |
| Mean | $86,089 | $75,885 |
| Median | $84,960 | $73,968 |
| Interquartile 25% (IQ1) | $68,316 | $61,794 |
| Interquartile 75% (IQ3) | $100,916 | $90,078 |
| Interquartile Range (IQR) | $32,600 | $28,284 |
| Standard Deviation (Sample) | $23,857 | $20,099 |
| Standard Deviation (Population) | $23,683 | $19,931 |
Similar Demographics by Householder Income Ages 25 - 44 years
Demographics Similar to Celtics by Householder Income Ages 25 - 44 years
In terms of householder income ages 25 - 44 years, the demographic groups most similar to Celtics are Immigrants from Colombia ($92,204, a difference of 0.040%), Spanish ($92,200, a difference of 0.040%), Immigrants from the Azores ($92,322, a difference of 0.090%), Samoan ($92,385, a difference of 0.16%), and Vietnamese ($92,089, a difference of 0.16%).
| Demographics | Rating | Rank | Householder Income Ages 25 - 44 years |
| Immigrants | Sierra Leone | 30.9 /100 | #188 | Fair $93,115 |
| Dutch | 30.5 /100 | #189 | Fair $93,081 |
| Welsh | 30.0 /100 | #190 | Fair $93,039 |
| Tlingit-Haida | 29.4 /100 | #191 | Fair $92,987 |
| Immigrants | Costa Rica | 28.2 /100 | #192 | Fair $92,876 |
| Samoans | 23.0 /100 | #193 | Fair $92,385 |
| Immigrants | Azores | 22.4 /100 | #194 | Fair $92,322 |
| Celtics | 21.6 /100 | #195 | Fair $92,241 |
| Immigrants | Colombia | 21.3 /100 | #196 | Fair $92,204 |
| Spanish | 21.2 /100 | #197 | Fair $92,200 |
| Vietnamese | 20.2 /100 | #198 | Fair $92,089 |
| Kenyans | 16.8 /100 | #199 | Poor $91,684 |
| Whites/Caucasians | 16.7 /100 | #200 | Poor $91,668 |
| Japanese | 16.4 /100 | #201 | Poor $91,624 |
| Ecuadorians | 16.0 /100 | #202 | Poor $91,574 |
Demographics Similar to Immigrants from Burma/Myanmar by Householder Income Ages 25 - 44 years
In terms of householder income ages 25 - 44 years, the demographic groups most similar to Immigrants from Burma/Myanmar are Immigrants from Nigeria ($86,589, a difference of 0.17%), Immigrants from El Salvador ($86,913, a difference of 0.20%), Immigrants from Venezuela ($87,038, a difference of 0.35%), Immigrants from West Indies ($87,063, a difference of 0.38%), and West Indian ($87,205, a difference of 0.54%).
| Demographics | Rating | Rank | Householder Income Ages 25 - 44 years |
| Immigrants | Ghana | 2.2 /100 | #239 | Tragic $87,760 |
| Nicaraguans | 2.2 /100 | #240 | Tragic $87,751 |
| Nigerians | 2.2 /100 | #241 | Tragic $87,730 |
| West Indians | 1.7 /100 | #242 | Tragic $87,205 |
| Immigrants | West Indies | 1.5 /100 | #243 | Tragic $87,063 |
| Immigrants | Venezuela | 1.5 /100 | #244 | Tragic $87,038 |
| Immigrants | El Salvador | 1.4 /100 | #245 | Tragic $86,913 |
| Immigrants | Burma/Myanmar | 1.3 /100 | #246 | Tragic $86,736 |
| Immigrants | Nigeria | 1.2 /100 | #247 | Tragic $86,589 |
| Immigrants | Sudan | 0.9 /100 | #248 | Tragic $86,109 |
| French American Indians | 0.8 /100 | #249 | Tragic $85,899 |
| Pennsylvania Germans | 0.8 /100 | #250 | Tragic $85,836 |
| Cape Verdeans | 0.8 /100 | #251 | Tragic $85,758 |
| Immigrants | Western Africa | 0.7 /100 | #252 | Tragic $85,676 |
| British West Indians | 0.7 /100 | #253 | Tragic $85,565 |