Immigrants from Cameroon vs Immigrants from Burma/Myanmar 10th Grade
COMPARE
Immigrants from Cameroon
Immigrants from Burma/Myanmar
10th Grade
10th Grade Comparison
Immigrants from Cameroon
Immigrants from Burma/Myanmar
93.0%
10TH GRADE
2.6/ 100
METRIC RATING
242nd/ 347
METRIC RANK
91.8%
10TH GRADE
0.0/ 100
METRIC RATING
292nd/ 347
METRIC RANK
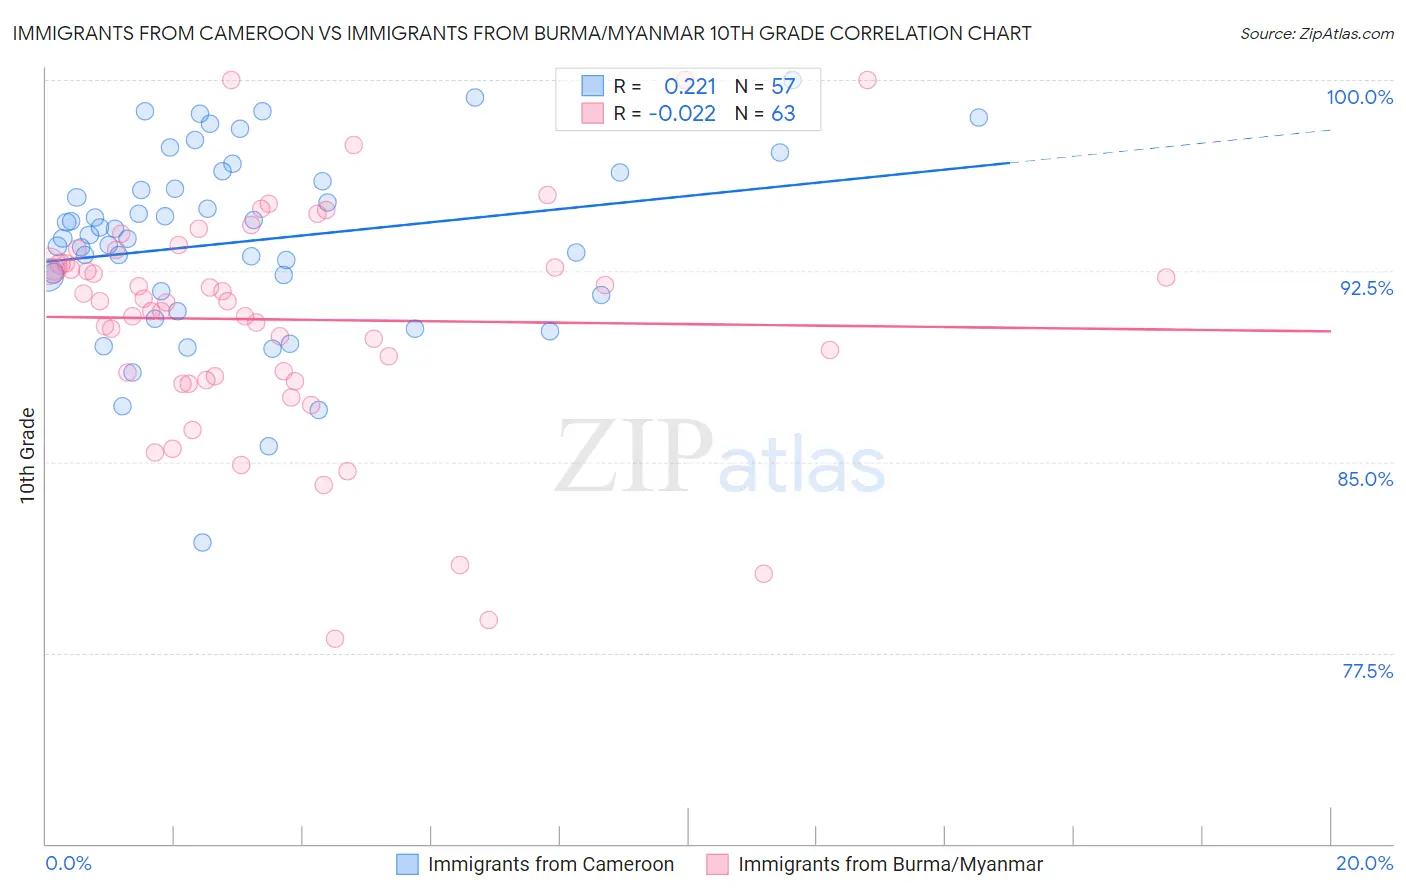
Immigrants from Cameroon vs Immigrants from Burma/Myanmar 10th Grade Correlation Chart
The statistical analysis conducted on geographies consisting of 130,618,704 people shows a weak positive correlation between the proportion of Immigrants from Cameroon and percentage of population with at least 10th grade education in the United States with a correlation coefficient (R) of 0.221 and weighted average of 93.0%. Similarly, the statistical analysis conducted on geographies consisting of 172,345,696 people shows no correlation between the proportion of Immigrants from Burma/Myanmar and percentage of population with at least 10th grade education in the United States with a correlation coefficient (R) of -0.022 and weighted average of 91.8%, a difference of 1.3%.
10th Grade Correlation Summary
| Measurement | Immigrants from Cameroon | Immigrants from Burma/Myanmar |
| Minimum | 81.8% | 78.1% |
| Maximum | 100.0% | 100.0% |
| Range | 18.2% | 21.9% |
| Mean | 93.7% | 90.6% |
| Median | 93.9% | 91.3% |
| Interquartile 25% (IQ1) | 91.6% | 88.2% |
| Interquartile 75% (IQ3) | 96.2% | 92.8% |
| Interquartile Range (IQR) | 4.6% | 4.6% |
| Standard Deviation (Sample) | 3.7% | 4.5% |
| Standard Deviation (Population) | 3.6% | 4.5% |
Similar Demographics by 10th Grade
Demographics Similar to Immigrants from Cameroon by 10th Grade
In terms of 10th grade, the demographic groups most similar to Immigrants from Cameroon are Immigrants from Somalia (93.0%, a difference of 0.0%), Senegalese (93.0%, a difference of 0.020%), Spanish American (92.9%, a difference of 0.050%), Uruguayan (92.9%, a difference of 0.080%), and Immigrants from Middle Africa (92.9%, a difference of 0.10%).
| Demographics | Rating | Rank | 10th Grade |
| Africans | 4.6 /100 | #235 | Tragic 93.1% |
| Afghans | 4.5 /100 | #236 | Tragic 93.1% |
| Immigrants | Panama | 4.3 /100 | #237 | Tragic 93.1% |
| Nigerians | 4.2 /100 | #238 | Tragic 93.1% |
| Costa Ricans | 4.2 /100 | #239 | Tragic 93.1% |
| Immigrants | Hong Kong | 4.2 /100 | #240 | Tragic 93.1% |
| Immigrants | Somalia | 2.7 /100 | #241 | Tragic 93.0% |
| Immigrants | Cameroon | 2.6 /100 | #242 | Tragic 93.0% |
| Senegalese | 2.4 /100 | #243 | Tragic 93.0% |
| Spanish Americans | 2.1 /100 | #244 | Tragic 92.9% |
| Uruguayans | 1.8 /100 | #245 | Tragic 92.9% |
| Immigrants | Middle Africa | 1.7 /100 | #246 | Tragic 92.9% |
| Immigrants | Afghanistan | 1.4 /100 | #247 | Tragic 92.8% |
| Colombians | 1.4 /100 | #248 | Tragic 92.8% |
| Immigrants | Senegal | 1.4 /100 | #249 | Tragic 92.8% |
Demographics Similar to Immigrants from Burma/Myanmar by 10th Grade
In terms of 10th grade, the demographic groups most similar to Immigrants from Burma/Myanmar are Immigrants from West Indies (91.8%, a difference of 0.0%), British West Indian (91.8%, a difference of 0.010%), Indonesian (91.8%, a difference of 0.020%), Sri Lankan (91.8%, a difference of 0.030%), and Haitian (91.8%, a difference of 0.050%).
| Demographics | Rating | Rank | 10th Grade |
| Immigrants | South Eastern Asia | 0.0 /100 | #285 | Tragic 92.1% |
| Yuman | 0.0 /100 | #286 | Tragic 92.0% |
| Pennsylvania Germans | 0.0 /100 | #287 | Tragic 91.9% |
| Immigrants | Laos | 0.0 /100 | #288 | Tragic 91.9% |
| Sri Lankans | 0.0 /100 | #289 | Tragic 91.8% |
| British West Indians | 0.0 /100 | #290 | Tragic 91.8% |
| Immigrants | West Indies | 0.0 /100 | #291 | Tragic 91.8% |
| Immigrants | Burma/Myanmar | 0.0 /100 | #292 | Tragic 91.8% |
| Indonesians | 0.0 /100 | #293 | Tragic 91.8% |
| Haitians | 0.0 /100 | #294 | Tragic 91.8% |
| Lumbee | 0.0 /100 | #295 | Tragic 91.7% |
| Immigrants | Grenada | 0.0 /100 | #296 | Tragic 91.6% |
| Fijians | 0.0 /100 | #297 | Tragic 91.5% |
| Cubans | 0.0 /100 | #298 | Tragic 91.5% |
| Immigrants | Haiti | 0.0 /100 | #299 | Tragic 91.4% |