Celtic vs Immigrants from Burma/Myanmar 4th Grade
COMPARE
Celtic
Immigrants from Burma/Myanmar
4th Grade
4th Grade Comparison
Celtics
Immigrants from Burma/Myanmar
98.1%
4TH GRADE
99.8/ 100
METRIC RATING
51st/ 347
METRIC RANK
96.3%
4TH GRADE
0.0/ 100
METRIC RATING
310th/ 347
METRIC RANK
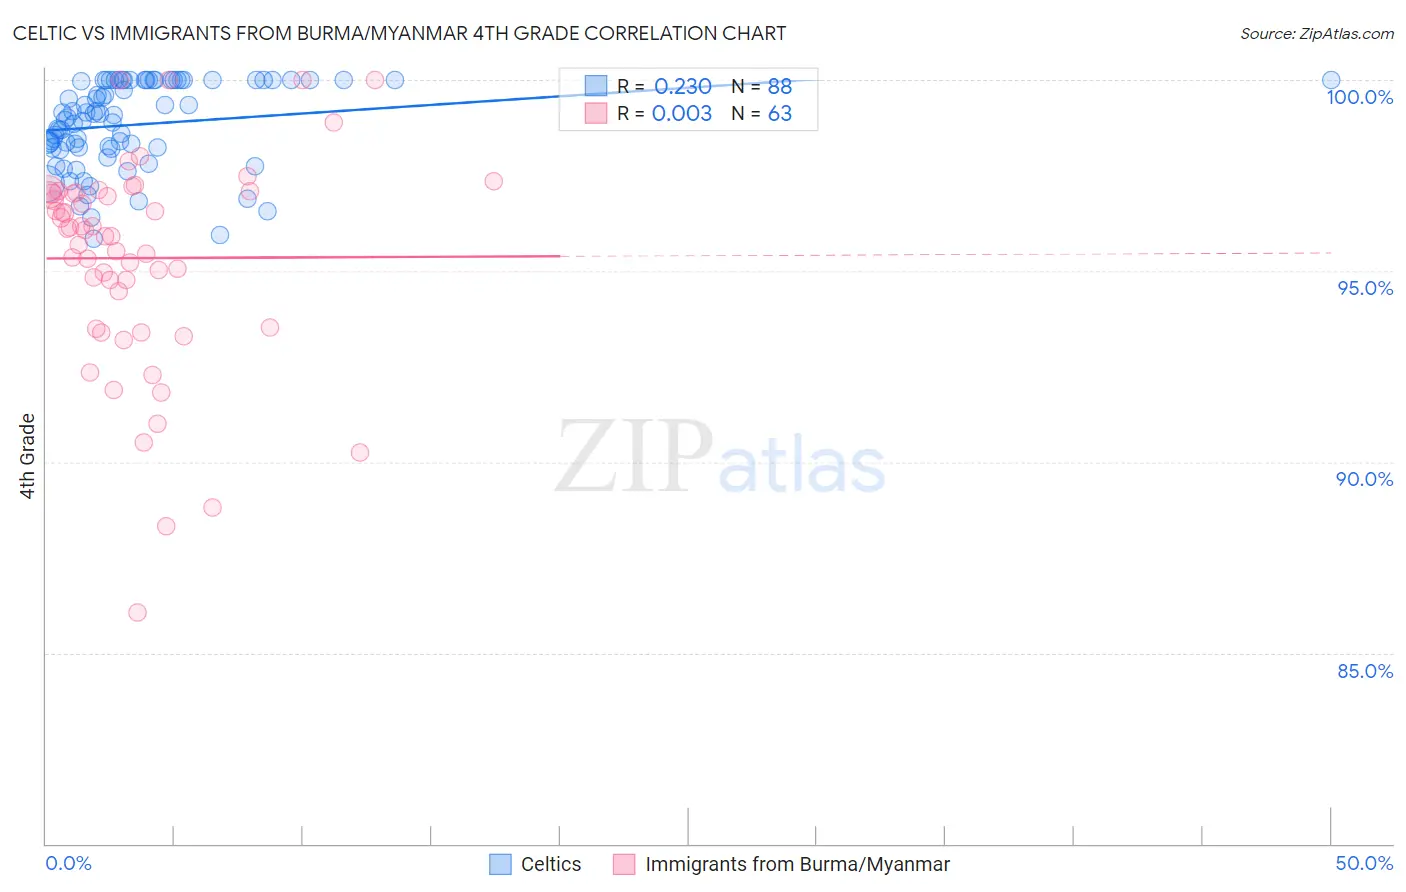
Celtic vs Immigrants from Burma/Myanmar 4th Grade Correlation Chart
The statistical analysis conducted on geographies consisting of 168,875,705 people shows a weak positive correlation between the proportion of Celtics and percentage of population with at least 4th grade education in the United States with a correlation coefficient (R) of 0.230 and weighted average of 98.1%. Similarly, the statistical analysis conducted on geographies consisting of 172,338,093 people shows no correlation between the proportion of Immigrants from Burma/Myanmar and percentage of population with at least 4th grade education in the United States with a correlation coefficient (R) of 0.003 and weighted average of 96.3%, a difference of 1.9%.
4th Grade Correlation Summary
| Measurement | Celtic | Immigrants from Burma/Myanmar |
| Minimum | 95.8% | 86.0% |
| Maximum | 100.0% | 100.0% |
| Range | 4.2% | 14.0% |
| Mean | 98.8% | 95.3% |
| Median | 99.1% | 96.1% |
| Interquartile 25% (IQ1) | 98.2% | 93.5% |
| Interquartile 75% (IQ3) | 100.0% | 97.1% |
| Interquartile Range (IQR) | 1.8% | 3.6% |
| Standard Deviation (Sample) | 1.1% | 2.8% |
| Standard Deviation (Population) | 1.1% | 2.8% |
Similar Demographics by 4th Grade
Demographics Similar to Celtics by 4th Grade
In terms of 4th grade, the demographic groups most similar to Celtics are Immigrants from Scotland (98.1%, a difference of 0.0%), Australian (98.1%, a difference of 0.0%), Estonian (98.1%, a difference of 0.010%), Bulgarian (98.1%, a difference of 0.010%), and Slavic (98.1%, a difference of 0.010%).
| Demographics | Rating | Rank | 4th Grade |
| Native Hawaiians | 99.9 /100 | #44 | Exceptional 98.1% |
| Czechoslovakians | 99.9 /100 | #45 | Exceptional 98.1% |
| Ottawa | 99.9 /100 | #46 | Exceptional 98.1% |
| Arapaho | 99.9 /100 | #47 | Exceptional 98.1% |
| Estonians | 99.8 /100 | #48 | Exceptional 98.1% |
| Bulgarians | 99.8 /100 | #49 | Exceptional 98.1% |
| Immigrants | Scotland | 99.8 /100 | #50 | Exceptional 98.1% |
| Celtics | 99.8 /100 | #51 | Exceptional 98.1% |
| Australians | 99.8 /100 | #52 | Exceptional 98.1% |
| Slavs | 99.8 /100 | #53 | Exceptional 98.1% |
| Maltese | 99.8 /100 | #54 | Exceptional 98.1% |
| Whites/Caucasians | 99.8 /100 | #55 | Exceptional 98.1% |
| Greeks | 99.8 /100 | #56 | Exceptional 98.1% |
| Austrians | 99.8 /100 | #57 | Exceptional 98.1% |
| Creek | 99.8 /100 | #58 | Exceptional 98.1% |
Demographics Similar to Immigrants from Burma/Myanmar by 4th Grade
In terms of 4th grade, the demographic groups most similar to Immigrants from Burma/Myanmar are Immigrants from Guyana (96.3%, a difference of 0.020%), Immigrants from Laos (96.3%, a difference of 0.030%), Immigrants from Haiti (96.3%, a difference of 0.040%), Immigrants from Bangladesh (96.2%, a difference of 0.050%), and Cape Verdean (96.2%, a difference of 0.050%).
| Demographics | Rating | Rank | 4th Grade |
| Guyanese | 0.0 /100 | #303 | Tragic 96.4% |
| Ecuadorians | 0.0 /100 | #304 | Tragic 96.4% |
| Immigrants | Caribbean | 0.0 /100 | #305 | Tragic 96.4% |
| Sri Lankans | 0.0 /100 | #306 | Tragic 96.4% |
| Immigrants | Haiti | 0.0 /100 | #307 | Tragic 96.3% |
| Immigrants | Laos | 0.0 /100 | #308 | Tragic 96.3% |
| Immigrants | Guyana | 0.0 /100 | #309 | Tragic 96.3% |
| Immigrants | Burma/Myanmar | 0.0 /100 | #310 | Tragic 96.3% |
| Immigrants | Bangladesh | 0.0 /100 | #311 | Tragic 96.2% |
| Cape Verdeans | 0.0 /100 | #312 | Tragic 96.2% |
| Indonesians | 0.0 /100 | #313 | Tragic 96.2% |
| Vietnamese | 0.0 /100 | #314 | Tragic 96.2% |
| Nicaraguans | 0.0 /100 | #315 | Tragic 96.2% |
| Immigrants | Ecuador | 0.0 /100 | #316 | Tragic 96.2% |
| Central American Indians | 0.0 /100 | #317 | Tragic 96.2% |