Afghan vs Immigrants from Burma/Myanmar 10th Grade
COMPARE
Afghan
Immigrants from Burma/Myanmar
10th Grade
10th Grade Comparison
Afghans
Immigrants from Burma/Myanmar
93.1%
10TH GRADE
4.5/ 100
METRIC RATING
236th/ 347
METRIC RANK
91.8%
10TH GRADE
0.0/ 100
METRIC RATING
292nd/ 347
METRIC RANK
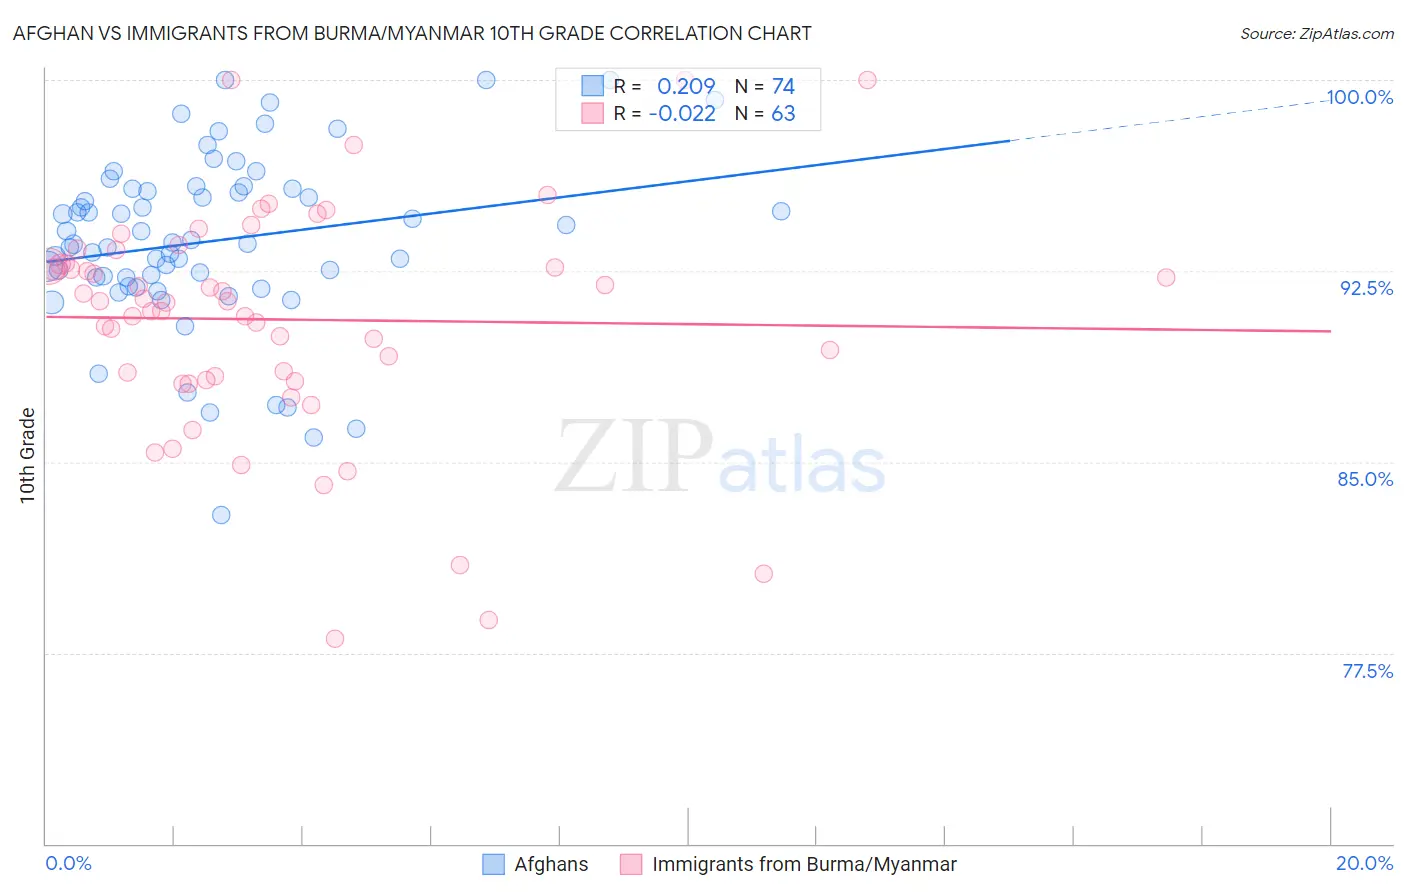
Afghan vs Immigrants from Burma/Myanmar 10th Grade Correlation Chart
The statistical analysis conducted on geographies consisting of 148,851,685 people shows a weak positive correlation between the proportion of Afghans and percentage of population with at least 10th grade education in the United States with a correlation coefficient (R) of 0.209 and weighted average of 93.1%. Similarly, the statistical analysis conducted on geographies consisting of 172,345,696 people shows no correlation between the proportion of Immigrants from Burma/Myanmar and percentage of population with at least 10th grade education in the United States with a correlation coefficient (R) of -0.022 and weighted average of 91.8%, a difference of 1.4%.
10th Grade Correlation Summary
| Measurement | Afghan | Immigrants from Burma/Myanmar |
| Minimum | 82.9% | 78.1% |
| Maximum | 100.0% | 100.0% |
| Range | 17.1% | 21.9% |
| Mean | 93.7% | 90.6% |
| Median | 93.6% | 91.3% |
| Interquartile 25% (IQ1) | 92.2% | 88.2% |
| Interquartile 75% (IQ3) | 95.7% | 92.8% |
| Interquartile Range (IQR) | 3.5% | 4.6% |
| Standard Deviation (Sample) | 3.4% | 4.5% |
| Standard Deviation (Population) | 3.4% | 4.5% |
Similar Demographics by 10th Grade
Demographics Similar to Afghans by 10th Grade
In terms of 10th grade, the demographic groups most similar to Afghans are African (93.1%, a difference of 0.0%), Subsaharan African (93.1%, a difference of 0.010%), Immigrants from Panama (93.1%, a difference of 0.010%), Immigrants from Africa (93.1%, a difference of 0.020%), and South American Indian (93.1%, a difference of 0.020%).
| Demographics | Rating | Rank | 10th Grade |
| Immigrants | Ethiopia | 5.1 /100 | #229 | Tragic 93.1% |
| Immigrants | Africa | 5.0 /100 | #230 | Tragic 93.1% |
| South American Indians | 4.9 /100 | #231 | Tragic 93.1% |
| Bahamians | 4.9 /100 | #232 | Tragic 93.1% |
| Comanche | 4.9 /100 | #233 | Tragic 93.1% |
| Sub-Saharan Africans | 4.7 /100 | #234 | Tragic 93.1% |
| Africans | 4.6 /100 | #235 | Tragic 93.1% |
| Afghans | 4.5 /100 | #236 | Tragic 93.1% |
| Immigrants | Panama | 4.3 /100 | #237 | Tragic 93.1% |
| Nigerians | 4.2 /100 | #238 | Tragic 93.1% |
| Costa Ricans | 4.2 /100 | #239 | Tragic 93.1% |
| Immigrants | Hong Kong | 4.2 /100 | #240 | Tragic 93.1% |
| Immigrants | Somalia | 2.7 /100 | #241 | Tragic 93.0% |
| Immigrants | Cameroon | 2.6 /100 | #242 | Tragic 93.0% |
| Senegalese | 2.4 /100 | #243 | Tragic 93.0% |
Demographics Similar to Immigrants from Burma/Myanmar by 10th Grade
In terms of 10th grade, the demographic groups most similar to Immigrants from Burma/Myanmar are Immigrants from West Indies (91.8%, a difference of 0.0%), British West Indian (91.8%, a difference of 0.010%), Indonesian (91.8%, a difference of 0.020%), Sri Lankan (91.8%, a difference of 0.030%), and Haitian (91.8%, a difference of 0.050%).
| Demographics | Rating | Rank | 10th Grade |
| Immigrants | South Eastern Asia | 0.0 /100 | #285 | Tragic 92.1% |
| Yuman | 0.0 /100 | #286 | Tragic 92.0% |
| Pennsylvania Germans | 0.0 /100 | #287 | Tragic 91.9% |
| Immigrants | Laos | 0.0 /100 | #288 | Tragic 91.9% |
| Sri Lankans | 0.0 /100 | #289 | Tragic 91.8% |
| British West Indians | 0.0 /100 | #290 | Tragic 91.8% |
| Immigrants | West Indies | 0.0 /100 | #291 | Tragic 91.8% |
| Immigrants | Burma/Myanmar | 0.0 /100 | #292 | Tragic 91.8% |
| Indonesians | 0.0 /100 | #293 | Tragic 91.8% |
| Haitians | 0.0 /100 | #294 | Tragic 91.8% |
| Lumbee | 0.0 /100 | #295 | Tragic 91.7% |
| Immigrants | Grenada | 0.0 /100 | #296 | Tragic 91.6% |
| Fijians | 0.0 /100 | #297 | Tragic 91.5% |
| Cubans | 0.0 /100 | #298 | Tragic 91.5% |
| Immigrants | Haiti | 0.0 /100 | #299 | Tragic 91.4% |