Celtic vs Filipino 9th Grade
COMPARE
Celtic
Filipino
9th Grade
9th Grade Comparison
Celtics
Filipinos
96.0%
9TH GRADE
99.9/ 100
METRIC RATING
50th/ 347
METRIC RANK
95.6%
9TH GRADE
98.5/ 100
METRIC RATING
96th/ 347
METRIC RANK
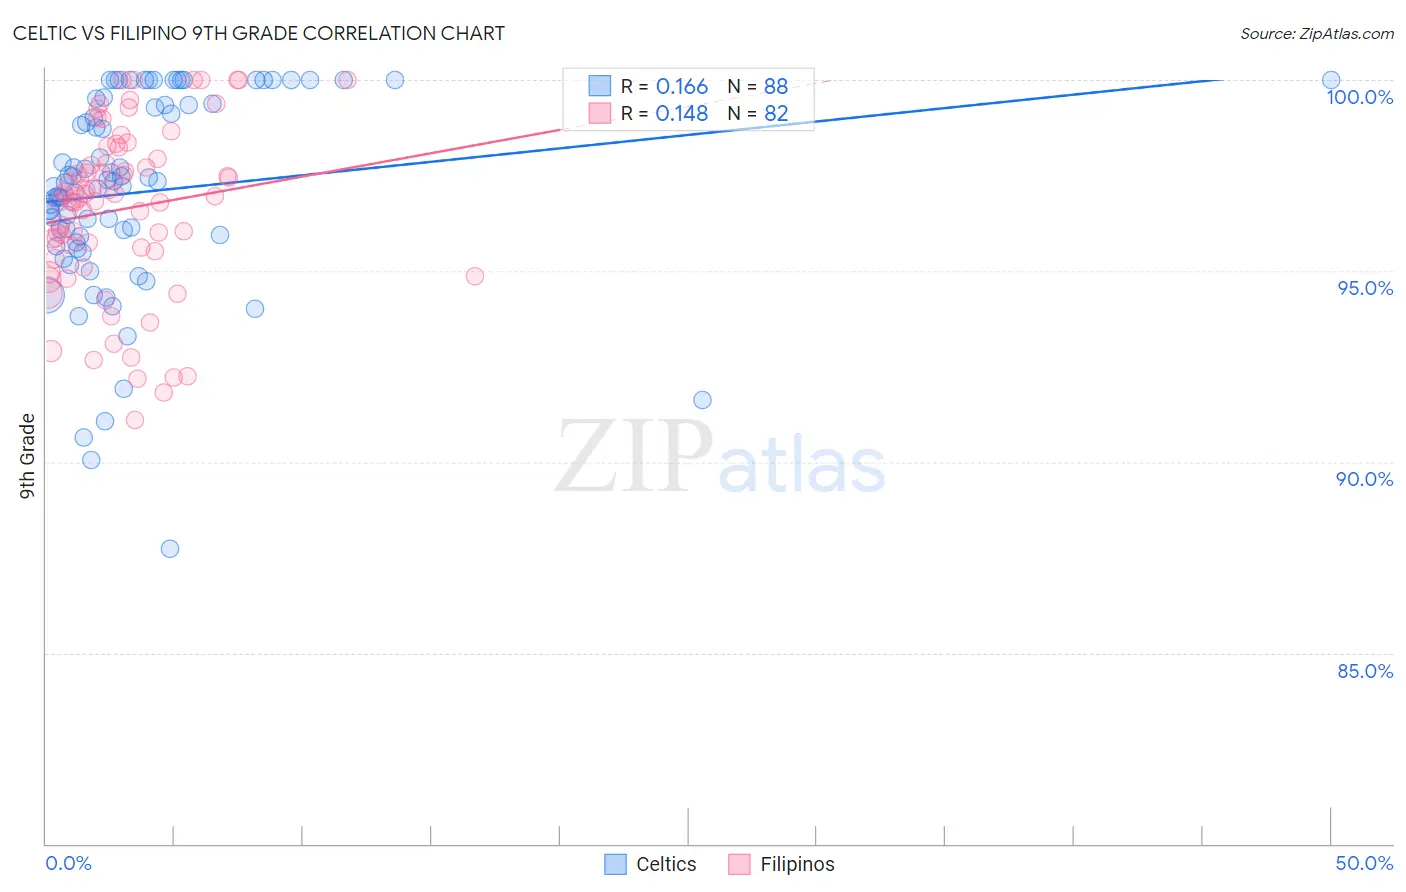
Celtic vs Filipino 9th Grade Correlation Chart
The statistical analysis conducted on geographies consisting of 168,876,981 people shows a poor positive correlation between the proportion of Celtics and percentage of population with at least 9th grade education in the United States with a correlation coefficient (R) of 0.166 and weighted average of 96.0%. Similarly, the statistical analysis conducted on geographies consisting of 254,352,171 people shows a poor positive correlation between the proportion of Filipinos and percentage of population with at least 9th grade education in the United States with a correlation coefficient (R) of 0.148 and weighted average of 95.6%, a difference of 0.45%.
9th Grade Correlation Summary
| Measurement | Celtic | Filipino |
| Minimum | 87.7% | 91.1% |
| Maximum | 100.0% | 100.0% |
| Range | 12.3% | 8.9% |
| Mean | 97.1% | 96.6% |
| Median | 97.3% | 96.9% |
| Interquartile 25% (IQ1) | 95.8% | 95.5% |
| Interquartile 75% (IQ3) | 99.4% | 97.9% |
| Interquartile Range (IQR) | 3.5% | 2.4% |
| Standard Deviation (Sample) | 2.6% | 2.2% |
| Standard Deviation (Population) | 2.6% | 2.2% |
Similar Demographics by 9th Grade
Demographics Similar to Celtics by 9th Grade
In terms of 9th grade, the demographic groups most similar to Celtics are Greek (96.0%, a difference of 0.010%), Immigrants from Northern Europe (96.0%, a difference of 0.010%), Russian (96.0%, a difference of 0.020%), Australian (96.0%, a difference of 0.020%), and Serbian (96.0%, a difference of 0.020%).
| Demographics | Rating | Rank | 9th Grade |
| Iranians | 99.9 /100 | #43 | Exceptional 96.1% |
| Alaska Natives | 99.9 /100 | #44 | Exceptional 96.1% |
| Crow | 99.9 /100 | #45 | Exceptional 96.1% |
| Immigrants | India | 99.9 /100 | #46 | Exceptional 96.1% |
| Russians | 99.9 /100 | #47 | Exceptional 96.0% |
| Australians | 99.9 /100 | #48 | Exceptional 96.0% |
| Greeks | 99.9 /100 | #49 | Exceptional 96.0% |
| Celtics | 99.9 /100 | #50 | Exceptional 96.0% |
| Immigrants | Northern Europe | 99.9 /100 | #51 | Exceptional 96.0% |
| Serbians | 99.9 /100 | #52 | Exceptional 96.0% |
| Austrians | 99.8 /100 | #53 | Exceptional 96.0% |
| Immigrants | Canada | 99.8 /100 | #54 | Exceptional 96.0% |
| Immigrants | Austria | 99.8 /100 | #55 | Exceptional 96.0% |
| Immigrants | North America | 99.8 /100 | #56 | Exceptional 96.0% |
| Macedonians | 99.8 /100 | #57 | Exceptional 96.0% |
Demographics Similar to Filipinos by 9th Grade
In terms of 9th grade, the demographic groups most similar to Filipinos are Delaware (95.6%, a difference of 0.0%), American (95.6%, a difference of 0.010%), Immigrants from Japan (95.6%, a difference of 0.020%), Menominee (95.6%, a difference of 0.020%), and Immigrants from Germany (95.6%, a difference of 0.030%).
| Demographics | Rating | Rank | 9th Grade |
| Yugoslavians | 98.9 /100 | #89 | Exceptional 95.7% |
| South Africans | 98.8 /100 | #90 | Exceptional 95.6% |
| Creek | 98.8 /100 | #91 | Exceptional 95.6% |
| Immigrants | Saudi Arabia | 98.8 /100 | #92 | Exceptional 95.6% |
| Immigrants | Germany | 98.7 /100 | #93 | Exceptional 95.6% |
| Immigrants | Latvia | 98.7 /100 | #94 | Exceptional 95.6% |
| Americans | 98.5 /100 | #95 | Exceptional 95.6% |
| Filipinos | 98.5 /100 | #96 | Exceptional 95.6% |
| Delaware | 98.4 /100 | #97 | Exceptional 95.6% |
| Immigrants | Japan | 98.4 /100 | #98 | Exceptional 95.6% |
| Menominee | 98.3 /100 | #99 | Exceptional 95.6% |
| Lebanese | 98.1 /100 | #100 | Exceptional 95.6% |
| Immigrants | Moldova | 97.9 /100 | #101 | Exceptional 95.5% |
| Immigrants | Switzerland | 97.7 /100 | #102 | Exceptional 95.5% |
| Potawatomi | 97.7 /100 | #103 | Exceptional 95.5% |