Immigrants from Africa vs Asian 9th Grade
COMPARE
Immigrants from Africa
Asian
9th Grade
9th Grade Comparison
Immigrants from Africa
Asians
94.3%
9TH GRADE
3.9/ 100
METRIC RATING
232nd/ 347
METRIC RANK
94.5%
9TH GRADE
9.9/ 100
METRIC RATING
217th/ 347
METRIC RANK
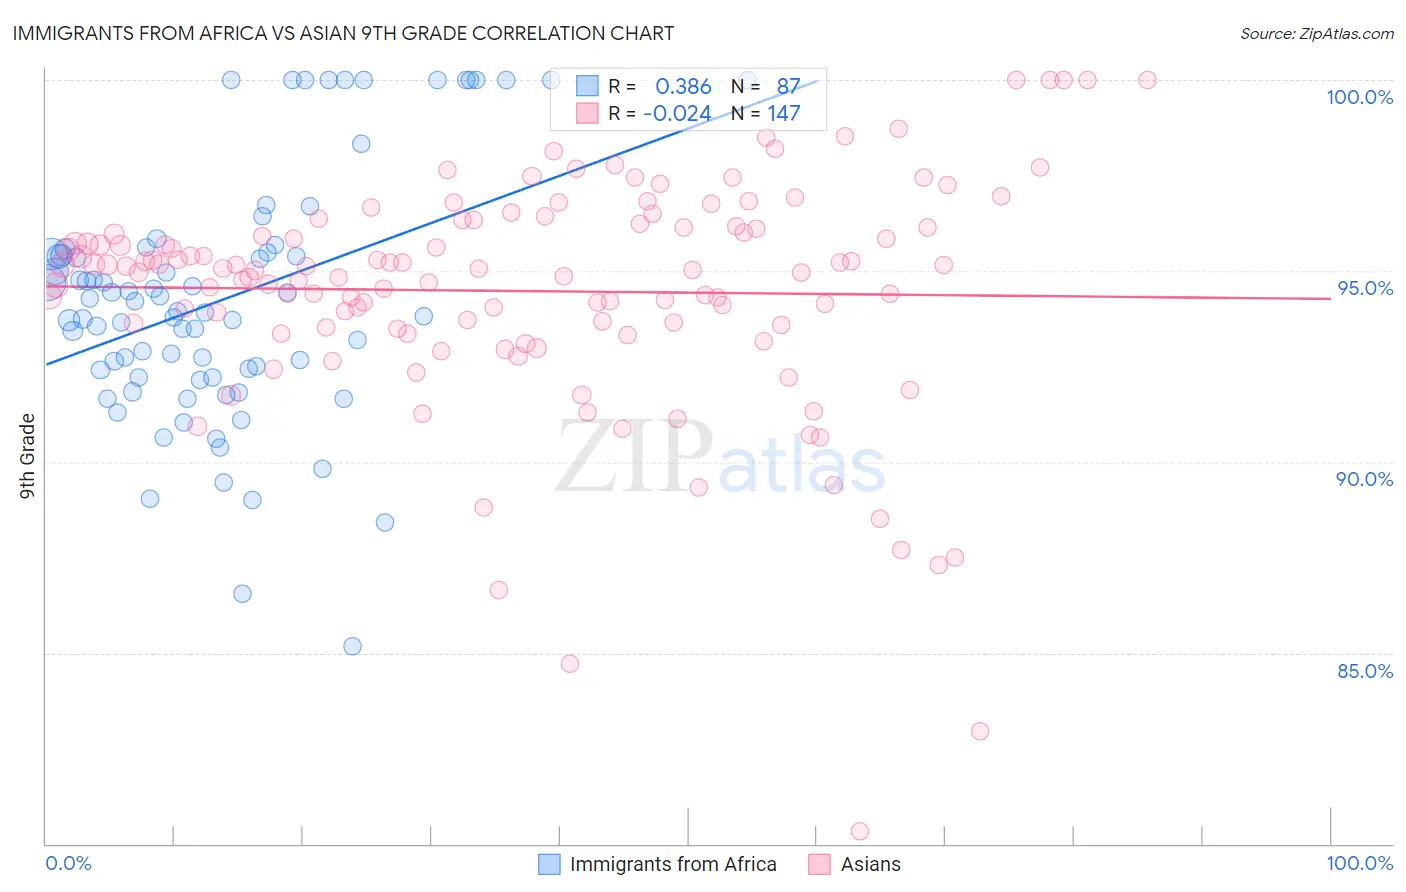
Immigrants from Africa vs Asian 9th Grade Correlation Chart
The statistical analysis conducted on geographies consisting of 469,381,733 people shows a mild positive correlation between the proportion of Immigrants from Africa and percentage of population with at least 9th grade education in the United States with a correlation coefficient (R) of 0.386 and weighted average of 94.3%. Similarly, the statistical analysis conducted on geographies consisting of 550,857,622 people shows no correlation between the proportion of Asians and percentage of population with at least 9th grade education in the United States with a correlation coefficient (R) of -0.024 and weighted average of 94.5%, a difference of 0.18%.
9th Grade Correlation Summary
| Measurement | Immigrants from Africa | Asian |
| Minimum | 85.2% | 80.3% |
| Maximum | 100.0% | 100.0% |
| Range | 14.8% | 19.7% |
| Mean | 94.2% | 94.5% |
| Median | 93.9% | 95.0% |
| Interquartile 25% (IQ1) | 92.2% | 93.5% |
| Interquartile 75% (IQ3) | 95.5% | 96.2% |
| Interquartile Range (IQR) | 3.3% | 2.6% |
| Standard Deviation (Sample) | 3.2% | 3.0% |
| Standard Deviation (Population) | 3.2% | 3.0% |
Demographics Similar to Immigrants from Africa and Asians by 9th Grade
In terms of 9th grade, the demographic groups most similar to Immigrants from Africa are Apache (94.3%, a difference of 0.010%), Immigrants from Panama (94.3%, a difference of 0.010%), Nigerian (94.3%, a difference of 0.010%), Costa Rican (94.3%, a difference of 0.020%), and Immigrants from Southern Europe (94.3%, a difference of 0.030%). Similarly, the demographic groups most similar to Asians are Portuguese (94.5%, a difference of 0.010%), Immigrants from Syria (94.5%, a difference of 0.020%), Immigrants from Western Asia (94.5%, a difference of 0.020%), African (94.5%, a difference of 0.020%), and Indian (Asian) (94.5%, a difference of 0.030%).
| Demographics | Rating | Rank | 9th Grade |
| Immigrants | Liberia | 11.8 /100 | #214 | Poor 94.5% |
| Immigrants | Syria | 11.0 /100 | #215 | Poor 94.5% |
| Immigrants | Western Asia | 10.7 /100 | #216 | Poor 94.5% |
| Asians | 9.9 /100 | #217 | Tragic 94.5% |
| Portuguese | 9.2 /100 | #218 | Tragic 94.5% |
| Africans | 9.0 /100 | #219 | Tragic 94.5% |
| Indians (Asian) | 8.6 /100 | #220 | Tragic 94.5% |
| Immigrants | Eastern Africa | 8.2 /100 | #221 | Tragic 94.5% |
| Immigrants | Asia | 7.7 /100 | #222 | Tragic 94.4% |
| Bahamians | 7.0 /100 | #223 | Tragic 94.4% |
| Tongans | 6.0 /100 | #224 | Tragic 94.4% |
| Ethiopians | 5.4 /100 | #225 | Tragic 94.4% |
| Sub-Saharan Africans | 5.4 /100 | #226 | Tragic 94.4% |
| Immigrants | Sierra Leone | 4.8 /100 | #227 | Tragic 94.4% |
| Lumbee | 4.7 /100 | #228 | Tragic 94.4% |
| Immigrants | Southern Europe | 4.5 /100 | #229 | Tragic 94.3% |
| Apache | 4.2 /100 | #230 | Tragic 94.3% |
| Immigrants | Panama | 4.0 /100 | #231 | Tragic 94.3% |
| Immigrants | Africa | 3.9 /100 | #232 | Tragic 94.3% |
| Nigerians | 3.7 /100 | #233 | Tragic 94.3% |
| Costa Ricans | 3.5 /100 | #234 | Tragic 94.3% |