Cape Verdean vs Immigrants from Zaire Associate's Degree
COMPARE
Cape Verdean
Immigrants from Zaire
Associate's Degree
Associate's Degree Comparison
Cape Verdeans
Immigrants from Zaire
38.8%
ASSOCIATE'S DEGREE
0.0/ 100
METRIC RATING
297th/ 347
METRIC RANK
45.0%
ASSOCIATE'S DEGREE
16.6/ 100
METRIC RATING
211th/ 347
METRIC RANK
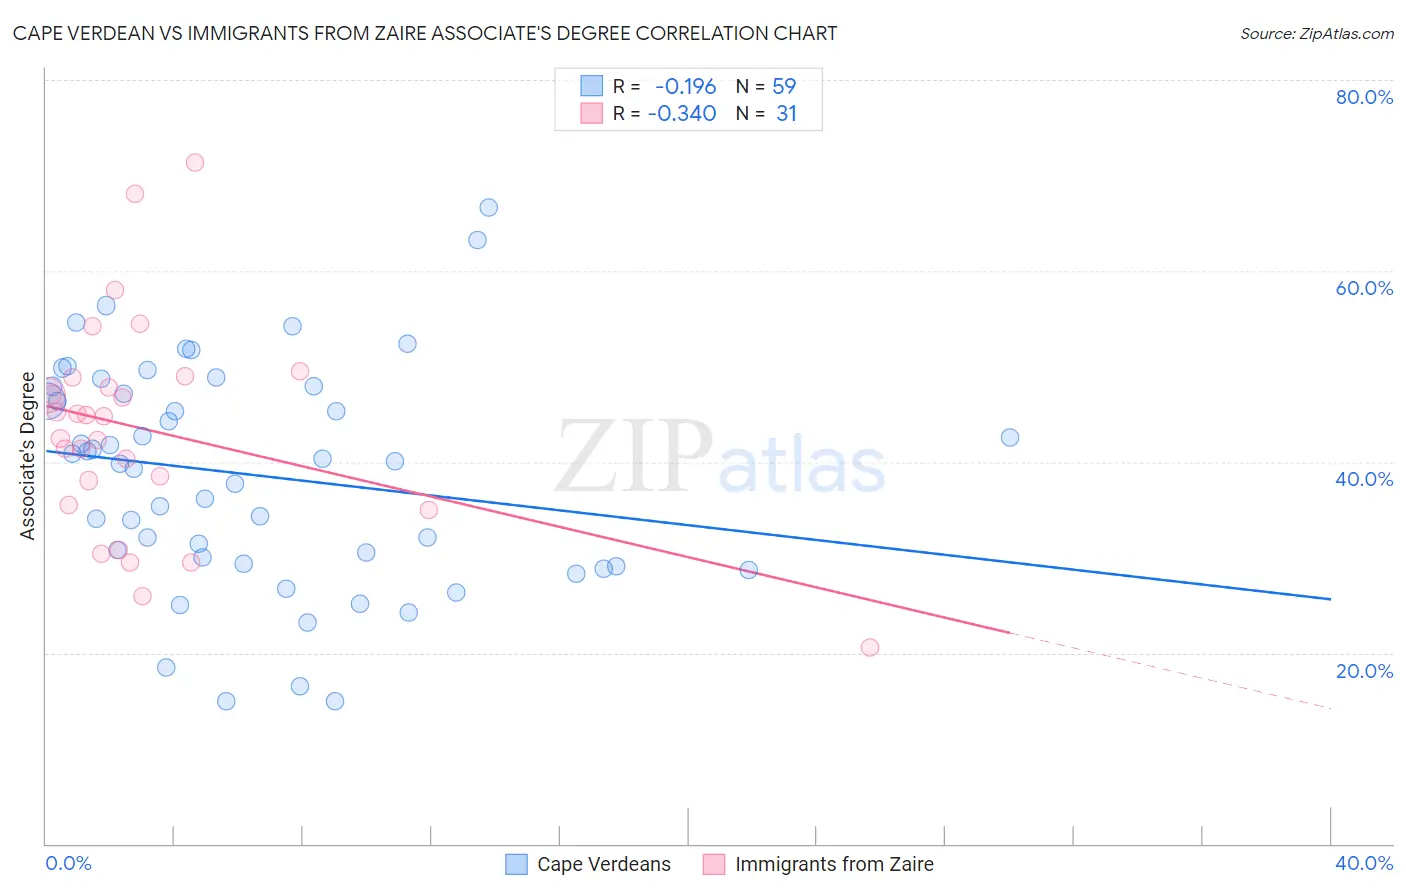
Cape Verdean vs Immigrants from Zaire Associate's Degree Correlation Chart
The statistical analysis conducted on geographies consisting of 107,580,652 people shows a poor negative correlation between the proportion of Cape Verdeans and percentage of population with at least associate's degree education in the United States with a correlation coefficient (R) of -0.196 and weighted average of 38.8%. Similarly, the statistical analysis conducted on geographies consisting of 107,255,700 people shows a mild negative correlation between the proportion of Immigrants from Zaire and percentage of population with at least associate's degree education in the United States with a correlation coefficient (R) of -0.340 and weighted average of 45.0%, a difference of 16.0%.
Associate's Degree Correlation Summary
| Measurement | Cape Verdean | Immigrants from Zaire |
| Minimum | 14.9% | 20.5% |
| Maximum | 66.6% | 71.3% |
| Range | 51.7% | 50.8% |
| Mean | 38.6% | 43.3% |
| Median | 40.1% | 44.8% |
| Interquartile 25% (IQ1) | 29.3% | 35.5% |
| Interquartile 75% (IQ3) | 47.9% | 48.8% |
| Interquartile Range (IQR) | 18.6% | 13.3% |
| Standard Deviation (Sample) | 11.7% | 11.2% |
| Standard Deviation (Population) | 11.6% | 11.0% |
Similar Demographics by Associate's Degree
Demographics Similar to Cape Verdeans by Associate's Degree
In terms of associate's degree, the demographic groups most similar to Cape Verdeans are Cheyenne (38.7%, a difference of 0.26%), Cherokee (38.9%, a difference of 0.28%), Ute (38.6%, a difference of 0.36%), Chickasaw (38.6%, a difference of 0.40%), and Honduran (38.9%, a difference of 0.45%).
| Demographics | Rating | Rank | Associate's Degree |
| Immigrants | Haiti | 0.0 /100 | #290 | Tragic 39.3% |
| Dominicans | 0.0 /100 | #291 | Tragic 39.3% |
| Blacks/African Americans | 0.0 /100 | #292 | Tragic 39.1% |
| Nepalese | 0.0 /100 | #293 | Tragic 39.0% |
| Salvadorans | 0.0 /100 | #294 | Tragic 39.0% |
| Hondurans | 0.0 /100 | #295 | Tragic 38.9% |
| Cherokee | 0.0 /100 | #296 | Tragic 38.9% |
| Cape Verdeans | 0.0 /100 | #297 | Tragic 38.8% |
| Cheyenne | 0.0 /100 | #298 | Tragic 38.7% |
| Ute | 0.0 /100 | #299 | Tragic 38.6% |
| Chickasaw | 0.0 /100 | #300 | Tragic 38.6% |
| Tsimshian | 0.0 /100 | #301 | Tragic 38.6% |
| Colville | 0.0 /100 | #302 | Tragic 38.5% |
| Guatemalans | 0.0 /100 | #303 | Tragic 38.5% |
| Sioux | 0.0 /100 | #304 | Tragic 38.5% |
Demographics Similar to Immigrants from Zaire by Associate's Degree
In terms of associate's degree, the demographic groups most similar to Immigrants from Zaire are Immigrants from Costa Rica (45.0%, a difference of 0.010%), Immigrants from Philippines (45.0%, a difference of 0.010%), Dutch (45.0%, a difference of 0.13%), Panamanian (45.1%, a difference of 0.23%), and French Canadian (44.9%, a difference of 0.23%).
| Demographics | Rating | Rank | Associate's Degree |
| Nigerians | 19.1 /100 | #204 | Poor 45.1% |
| Immigrants | Thailand | 18.9 /100 | #205 | Poor 45.1% |
| German Russians | 18.9 /100 | #206 | Poor 45.1% |
| Panamanians | 18.4 /100 | #207 | Poor 45.1% |
| Dutch | 17.6 /100 | #208 | Poor 45.0% |
| Immigrants | Costa Rica | 16.7 /100 | #209 | Poor 45.0% |
| Immigrants | Philippines | 16.7 /100 | #210 | Poor 45.0% |
| Immigrants | Zaire | 16.6 /100 | #211 | Poor 45.0% |
| French Canadians | 15.0 /100 | #212 | Poor 44.9% |
| Immigrants | Ghana | 14.2 /100 | #213 | Poor 44.8% |
| Immigrants | Middle Africa | 12.7 /100 | #214 | Poor 44.7% |
| Immigrants | Panama | 12.4 /100 | #215 | Poor 44.7% |
| Immigrants | Nigeria | 11.4 /100 | #216 | Poor 44.6% |
| Immigrants | Immigrants | 10.5 /100 | #217 | Poor 44.5% |
| Spanish | 9.4 /100 | #218 | Tragic 44.4% |