Cape Verdean vs Osage Associate's Degree
COMPARE
Cape Verdean
Osage
Associate's Degree
Associate's Degree Comparison
Cape Verdeans
Osage
38.8%
ASSOCIATE'S DEGREE
0.0/ 100
METRIC RATING
297th/ 347
METRIC RANK
41.5%
ASSOCIATE'S DEGREE
0.3/ 100
METRIC RATING
264th/ 347
METRIC RANK
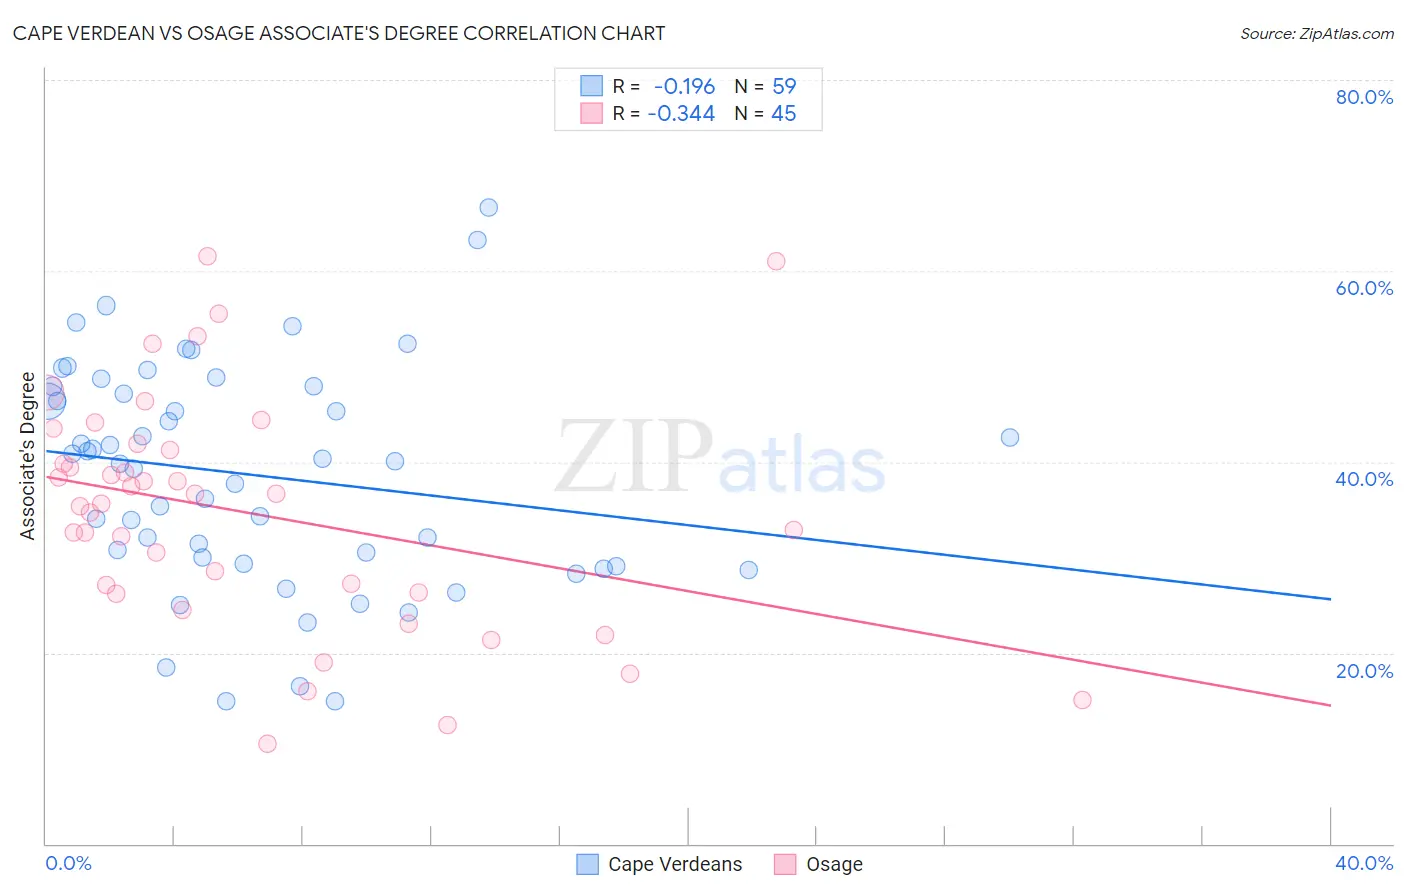
Cape Verdean vs Osage Associate's Degree Correlation Chart
The statistical analysis conducted on geographies consisting of 107,580,652 people shows a poor negative correlation between the proportion of Cape Verdeans and percentage of population with at least associate's degree education in the United States with a correlation coefficient (R) of -0.196 and weighted average of 38.8%. Similarly, the statistical analysis conducted on geographies consisting of 91,808,929 people shows a mild negative correlation between the proportion of Osage and percentage of population with at least associate's degree education in the United States with a correlation coefficient (R) of -0.344 and weighted average of 41.5%, a difference of 6.9%.
Associate's Degree Correlation Summary
| Measurement | Cape Verdean | Osage |
| Minimum | 14.9% | 10.4% |
| Maximum | 66.6% | 61.5% |
| Range | 51.7% | 51.1% |
| Mean | 38.6% | 34.6% |
| Median | 40.1% | 35.6% |
| Interquartile 25% (IQ1) | 29.3% | 26.3% |
| Interquartile 75% (IQ3) | 47.9% | 41.5% |
| Interquartile Range (IQR) | 18.6% | 15.3% |
| Standard Deviation (Sample) | 11.7% | 12.2% |
| Standard Deviation (Population) | 11.6% | 12.1% |
Similar Demographics by Associate's Degree
Demographics Similar to Cape Verdeans by Associate's Degree
In terms of associate's degree, the demographic groups most similar to Cape Verdeans are Cheyenne (38.7%, a difference of 0.26%), Cherokee (38.9%, a difference of 0.28%), Ute (38.6%, a difference of 0.36%), Chickasaw (38.6%, a difference of 0.40%), and Honduran (38.9%, a difference of 0.45%).
| Demographics | Rating | Rank | Associate's Degree |
| Immigrants | Haiti | 0.0 /100 | #290 | Tragic 39.3% |
| Dominicans | 0.0 /100 | #291 | Tragic 39.3% |
| Blacks/African Americans | 0.0 /100 | #292 | Tragic 39.1% |
| Nepalese | 0.0 /100 | #293 | Tragic 39.0% |
| Salvadorans | 0.0 /100 | #294 | Tragic 39.0% |
| Hondurans | 0.0 /100 | #295 | Tragic 38.9% |
| Cherokee | 0.0 /100 | #296 | Tragic 38.9% |
| Cape Verdeans | 0.0 /100 | #297 | Tragic 38.8% |
| Cheyenne | 0.0 /100 | #298 | Tragic 38.7% |
| Ute | 0.0 /100 | #299 | Tragic 38.6% |
| Chickasaw | 0.0 /100 | #300 | Tragic 38.6% |
| Tsimshian | 0.0 /100 | #301 | Tragic 38.6% |
| Colville | 0.0 /100 | #302 | Tragic 38.5% |
| Guatemalans | 0.0 /100 | #303 | Tragic 38.5% |
| Sioux | 0.0 /100 | #304 | Tragic 38.5% |
Demographics Similar to Osage by Associate's Degree
In terms of associate's degree, the demographic groups most similar to Osage are Immigrants from Jamaica (41.5%, a difference of 0.010%), Bahamian (41.5%, a difference of 0.030%), Nicaraguan (41.5%, a difference of 0.12%), Marshallese (41.6%, a difference of 0.25%), and Malaysian (41.6%, a difference of 0.44%).
| Demographics | Rating | Rank | Associate's Degree |
| Spanish Americans | 0.5 /100 | #257 | Tragic 41.8% |
| Japanese | 0.5 /100 | #258 | Tragic 41.7% |
| Malaysians | 0.4 /100 | #259 | Tragic 41.6% |
| Marshallese | 0.4 /100 | #260 | Tragic 41.6% |
| Nicaraguans | 0.4 /100 | #261 | Tragic 41.5% |
| Bahamians | 0.4 /100 | #262 | Tragic 41.5% |
| Immigrants | Jamaica | 0.3 /100 | #263 | Tragic 41.5% |
| Osage | 0.3 /100 | #264 | Tragic 41.5% |
| Africans | 0.2 /100 | #265 | Tragic 41.1% |
| Samoans | 0.2 /100 | #266 | Tragic 41.1% |
| Hawaiians | 0.2 /100 | #267 | Tragic 40.9% |
| Central American Indians | 0.2 /100 | #268 | Tragic 40.8% |
| Americans | 0.2 /100 | #269 | Tragic 40.8% |
| Chippewa | 0.2 /100 | #270 | Tragic 40.7% |
| Immigrants | Laos | 0.1 /100 | #271 | Tragic 40.7% |