Cape Verdean vs Immigrants from Peru Bachelor's Degree

COMPARE

Cape Verdean
Race
Ancestry
AfghanAfricanAlaska NativeAlaskan AthabascanAlbanianAleutAlsatianAmericanApacheArabArapahoArgentineanArmenianAssyrian/Chaldean/SyriacAustralianAustrianBahamianBangladeshiBarbadianBasqueBelgianBelizeanBermudanBhutaneseBlackfeetBolivianBrazilianBritishBritish West IndianBulgarianBurmeseCajunCambodianCanadianCape VerdeanCarpatho RusynCelticCentral AmericanCentral American IndianCherokeeCheyenneChickasawChileanChineseChippewaChoctawColombianColvilleComancheCosta RicanCreeCreekCroatianCrowCubanCypriotCzechCzechoslovakianDanishDelawareDominicanDutchDutch West IndianEastern EuropeanEcuadorianEgyptianEnglishEstonianEthiopianEuropeanFijianFilipinoFinnishFrenchFrench American IndianFrench CanadianGermanGerman RussianGhanaianGreekGuamanian/ChamorroGuatemalanGuyaneseHaitianHmongHonduranHopiHoumaHungarianIcelanderIndian (Asian)IndonesianInupiatIranianIraqiIrishIroquoisIsraeliItalianJamaicanJapaneseJordanianKenyanKiowaKoreanLaotianLatvianLebaneseLiberianLithuanianLumbeeLuxembourgerMacedonianMalaysianMalteseMarshalleseMenomineeMexicanMexican American IndianMongolianMoroccanNative HawaiianNavajoNepaleseNew ZealanderNicaraguanNigerianNorthern EuropeanNorwegianOkinawanOsageOttawaPaiutePakistaniPalestinianPanamanianParaguayanPennsylvania GermanPeruvianPimaPolishPortuguesePotawatomiPuebloPuerto RicanPuget Sound SalishRomanianRussianSalvadoranSamoanScandinavianScotch-IrishScottishSeminoleSenegaleseSerbianShoshoneSierra LeoneanSiouxSlavicSlovakSloveneSomaliSouth AfricanSouth AmericanSouth American IndianSoviet UnionSpaniardSpanishSpanish AmericanSpanish American IndianSri LankanSubsaharan AfricanSudaneseSwedishSwissSyrianTaiwaneseThaiTlingit-HaidaTohono O'OdhamTonganTrinidadian and TobagonianTsimshianTurkishU.S. Virgin IslanderUgandanUkrainianUruguayanUteVenezuelanVietnameseWelshWest IndianYakamaYaquiYugoslavianYumanYup'ikZimbabwean
Immigration
NonimmigrantsImmigrantsAfghanistanAfricaAlbaniaArgentinaArmeniaAsiaAustraliaAustriaBahamasBangladeshBarbadosBelarusBelgiumBelizeBoliviaBosnia and HerzegovinaBrazilBulgariaBurma/MyanmarCabo VerdeCambodiaCameroonCanadaCaribbeanCentral AmericaChileChinaColombiaCongoCosta RicaCroatiaCubaCzechoslovakiaDenmarkDominicaDominican RepublicEastern AfricaEastern AsiaEastern EuropeEcuadorEgyptEl SalvadorEnglandEritreaEthiopiaEuropeFijiFranceGermanyGhanaGreeceGrenadaGuatemalaGuyanaHaitiHondurasHong KongHungaryIndiaIndonesiaIranIraqIrelandIsraelItalyJamaicaJapanJordanKazakhstanKenyaKoreaKuwaitLaosLatin AmericaLatviaLebanonLiberiaLithuaniaMalaysiaMexicoMicronesiaMiddle AfricaMoldovaMoroccoNepalNetherlandsNicaraguaNigeriaNorth AmericaNorth MacedoniaNorthern AfricaNorthern EuropeNorwayOceaniaPakistanPanamaPhilippinesPolandPortugalRomaniaRussiaSaudi ArabiaScotlandSenegalSerbiaSierra LeoneSingaporeSomaliaSouth AfricaSouth AmericaSouth Central AsiaSouth Eastern AsiaSouthern EuropeSpainSri LankaSt. Vincent and the GrenadinesSudanSwedenSwitzerlandSyriaTaiwanThailandTrinidad and TobagoTurkeyUgandaUkraineUruguayUzbekistanVenezuelaVietnamWest IndiesWestern AfricaWestern AsiaWestern EuropeYemenZaireZimbabweAzores
Immigrants from Peru
Race
Ancestry
AfghanAfricanAlaska NativeAlaskan AthabascanAlbanianAleutAlsatianAmericanApacheArabArapahoArgentineanArmenianAssyrian/Chaldean/SyriacAustralianAustrianBahamianBangladeshiBarbadianBasqueBelgianBelizeanBermudanBhutaneseBlackfeetBolivianBrazilianBritishBritish West IndianBulgarianBurmeseCajunCambodianCanadianCarpatho RusynCelticCentral AmericanCentral American IndianCherokeeCheyenneChickasawChileanChineseChippewaChoctawColombianColvilleComancheCosta RicanCreeCreekCroatianCrowCubanCypriotCzechCzechoslovakianDanishDelawareDominicanDutchDutch West IndianEastern EuropeanEcuadorianEgyptianEnglishEstonianEthiopianEuropeanFijianFilipinoFinnishFrenchFrench American IndianFrench CanadianGermanGerman RussianGhanaianGreekGuamanian/ChamorroGuatemalanGuyaneseHaitianHmongHonduranHopiHoumaHungarianIcelanderIndian (Asian)IndonesianInupiatIranianIraqiIrishIroquoisIsraeliItalianJamaicanJapaneseJordanianKenyanKiowaKoreanLaotianLatvianLebaneseLiberianLithuanianLumbeeLuxembourgerMacedonianMalaysianMalteseMarshalleseMenomineeMexicanMexican American IndianMongolianMoroccanNative HawaiianNavajoNepaleseNew ZealanderNicaraguanNigerianNorthern EuropeanNorwegianOkinawanOsageOttawaPaiutePakistaniPalestinianPanamanianParaguayanPennsylvania GermanPeruvianPimaPolishPortuguesePotawatomiPuebloPuerto RicanPuget Sound SalishRomanianRussianSalvadoranSamoanScandinavianScotch-IrishScottishSeminoleSenegaleseSerbianShoshoneSierra LeoneanSiouxSlavicSlovakSloveneSomaliSouth AfricanSouth AmericanSouth American IndianSoviet UnionSpaniardSpanishSpanish AmericanSpanish American IndianSri LankanSubsaharan AfricanSudaneseSwedishSwissSyrianTaiwaneseThaiTlingit-HaidaTohono O'OdhamTonganTrinidadian and TobagonianTsimshianTurkishU.S. Virgin IslanderUgandanUkrainianUruguayanUteVenezuelanVietnameseWelshWest IndianYakamaYaquiYugoslavianYumanYup'ikZimbabwean
Immigration
NonimmigrantsImmigrantsAfghanistanAfricaAlbaniaArgentinaArmeniaAsiaAustraliaAustriaBahamasBangladeshBarbadosBelarusBelgiumBelizeBoliviaBosnia and HerzegovinaBrazilBulgariaBurma/MyanmarCabo VerdeCambodiaCameroonCanadaCaribbeanCentral AmericaChileChinaColombiaCongoCosta RicaCroatiaCubaCzechoslovakiaDenmarkDominicaDominican RepublicEastern AfricaEastern AsiaEastern EuropeEcuadorEgyptEl SalvadorEnglandEritreaEthiopiaEuropeFijiFranceGermanyGhanaGreeceGrenadaGuatemalaGuyanaHaitiHondurasHong KongHungaryIndiaIndonesiaIranIraqIrelandIsraelItalyJamaicaJapanJordanKazakhstanKenyaKoreaKuwaitLaosLatin AmericaLatviaLebanonLiberiaLithuaniaMalaysiaMexicoMicronesiaMiddle AfricaMoldovaMoroccoNepalNetherlandsNicaraguaNigeriaNorth AmericaNorth MacedoniaNorthern AfricaNorthern EuropeNorwayOceaniaPakistanPanamaPeruPhilippinesPolandPortugalRomaniaRussiaSaudi ArabiaScotlandSenegalSerbiaSierra LeoneSingaporeSomaliaSouth AfricaSouth AmericaSouth Central AsiaSouth Eastern AsiaSouthern EuropeSpainSri LankaSt. Vincent and the GrenadinesSudanSwedenSwitzerlandSyriaTaiwanThailandTrinidad and TobagoTurkeyUgandaUkraineUruguayUzbekistanVenezuelaVietnamWest IndiesWestern AfricaWestern AsiaWestern EuropeYemenZaireZimbabweAzores
Bachelor's Degree
Income
Poverty
Unemployment
Labor Participation
Family Structure
Vehicle Availability
Education Level
Disability

Bachelor's Degree Comparison

Cape Verdeans

Immigrants from Peru

Tragic
Average
30.9%
BACHELOR'S DEGREE
0.1/ 100
METRIC RATING
293rd/ 347
METRIC RANK
37.5%
BACHELOR'S DEGREE
41.3/ 100
METRIC RATING
185th/ 347
METRIC RANK

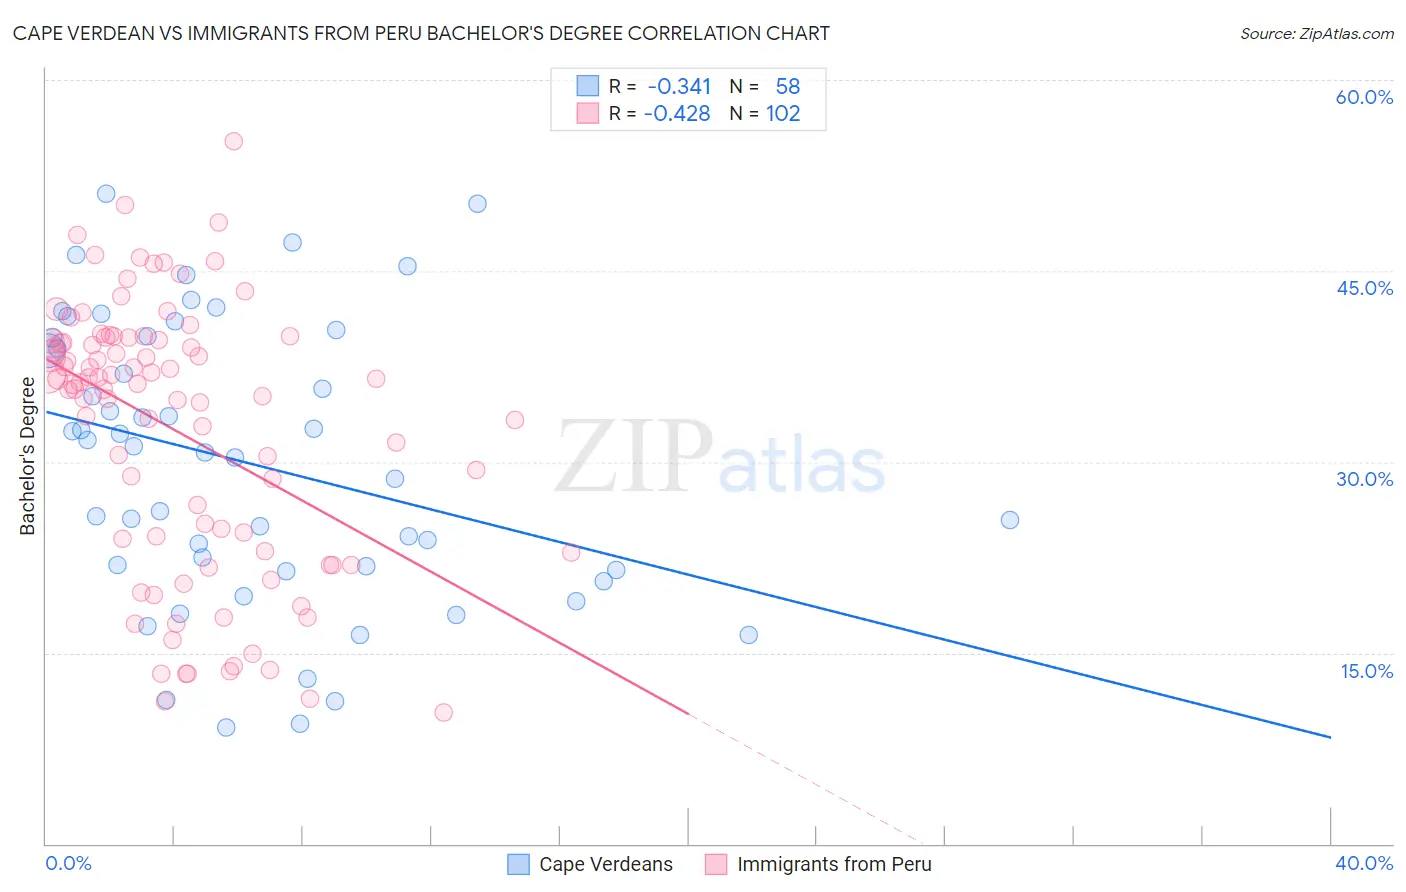
Cape Verdean vs Immigrants from Peru Bachelor's Degree Correlation Chart

The statistical analysis conducted on geographies consisting of 107,579,192 people shows a mild negative correlation between the proportion of Cape Verdeans and percentage of population with at least bachelor's degree education in the United States with a correlation coefficient (R) of -0.341 and weighted average of 30.9%. Similarly, the statistical analysis conducted on geographies consisting of 328,855,740 people shows a moderate negative correlation between the proportion of Immigrants from Peru and percentage of population with at least bachelor's degree education in the United States with a correlation coefficient (R) of -0.428 and weighted average of 37.5%, a difference of 21.5%.
Cape Verdean vs Immigrants from Peru Bachelor's Degree

Bachelor's Degree Correlation Summary

MeasurementCape VerdeanImmigrants from Peru
Minimum9.1%10.3%
Maximum51.0%55.2%
Range41.9%44.9%
Mean29.9%32.4%
Median31.0%36.1%
Interquartile 25% (IQ1)21.5%23.0%
Interquartile 75% (IQ3)39.7%39.5%
Interquartile Range (IQR)18.2%16.5%
Standard Deviation (Sample)11.0%10.6%
Standard Deviation (Population)10.9%10.5%

Similar Demographics by Bachelor's Degree

Demographics Similar to Cape Verdeans by Bachelor's Degree

In terms of bachelor's degree, the demographic groups most similar to Cape Verdeans are Ute (30.9%, a difference of 0.090%), Black/African American (30.9%, a difference of 0.18%), Immigrants from Honduras (30.9%, a difference of 0.21%), Puerto Rican (31.0%, a difference of 0.26%), and Guatemalan (31.0%, a difference of 0.40%).
DemographicsRating | RankBachelor's Degree
Immigrants | El Salvador
0.1
/100
|
#286
Tragic
31.3%
Ottawa
0.1
/100
|
#287
Tragic
31.1%
Guatemalans
0.1
/100
|
#288
Tragic
31.0%
Puerto Ricans
0.1
/100
|
#289
Tragic
31.0%
Immigrants | Honduras
0.1
/100
|
#290
Tragic
30.9%
Blacks/African Americans
0.1
/100
|
#291
Tragic
30.9%
Ute
0.1
/100
|
#292
Tragic
30.9%
Cape Verdeans
0.1
/100
|
#293
Tragic
30.9%
Immigrants | Guatemala
0.0
/100
|
#294
Tragic
30.8%
Immigrants | Dominican Republic
0.0
/100
|
#295
Tragic
30.7%
Puget Sound Salish
0.0
/100
|
#296
Tragic
30.7%
Immigrants | Haiti
0.0
/100
|
#297
Tragic
30.6%
Chippewa
0.0
/100
|
#298
Tragic
30.6%
Chickasaw
0.0
/100
|
#299
Tragic
30.4%
Immigrants | Micronesia
0.0
/100
|
#300
Tragic
30.4%

Demographics Similar to Immigrants from Peru by Bachelor's Degree

In terms of bachelor's degree, the demographic groups most similar to Immigrants from Peru are Scandinavian (37.5%, a difference of 0.040%), Senegalese (37.5%, a difference of 0.080%), Norwegian (37.5%, a difference of 0.10%), English (37.4%, a difference of 0.17%), and Immigrants from Bosnia and Herzegovina (37.6%, a difference of 0.21%).
DemographicsRating | RankBachelor's Degree
Immigrants | Cameroon
46.8
/100
|
#178
Average
37.7%
Immigrants | Colombia
45.4
/100
|
#179
Average
37.7%
Irish
44.3
/100
|
#180
Average
37.6%
Immigrants | Senegal
43.8
/100
|
#181
Average
37.6%
Immigrants | Bosnia and Herzegovina
43.4
/100
|
#182
Average
37.6%
Senegalese
42.2
/100
|
#183
Average
37.5%
Scandinavians
41.7
/100
|
#184
Average
37.5%
Immigrants | Peru
41.3
/100
|
#185
Average
37.5%
Norwegians
40.4
/100
|
#186
Average
37.5%
English
39.7
/100
|
#187
Fair
37.4%
Immigrants | Oceania
37.3
/100
|
#188
Fair
37.3%
Slovaks
36.9
/100
|
#189
Fair
37.3%
Swiss
34.1
/100
|
#190
Fair
37.2%
Nigerians
33.9
/100
|
#191
Fair
37.2%
Immigrants | Vietnam
32.1
/100
|
#192
Fair
37.1%