Cape Verdean vs Assyrian/Chaldean/Syriac Bachelor's Degree
COMPARE
Cape Verdean
Assyrian/Chaldean/Syriac
Bachelor's Degree
Bachelor's Degree Comparison
Cape Verdeans
Assyrians/Chaldeans/Syriacs
30.9%
BACHELOR'S DEGREE
0.1/ 100
METRIC RATING
293rd/ 347
METRIC RANK
39.8%
BACHELOR'S DEGREE
89.4/ 100
METRIC RATING
134th/ 347
METRIC RANK
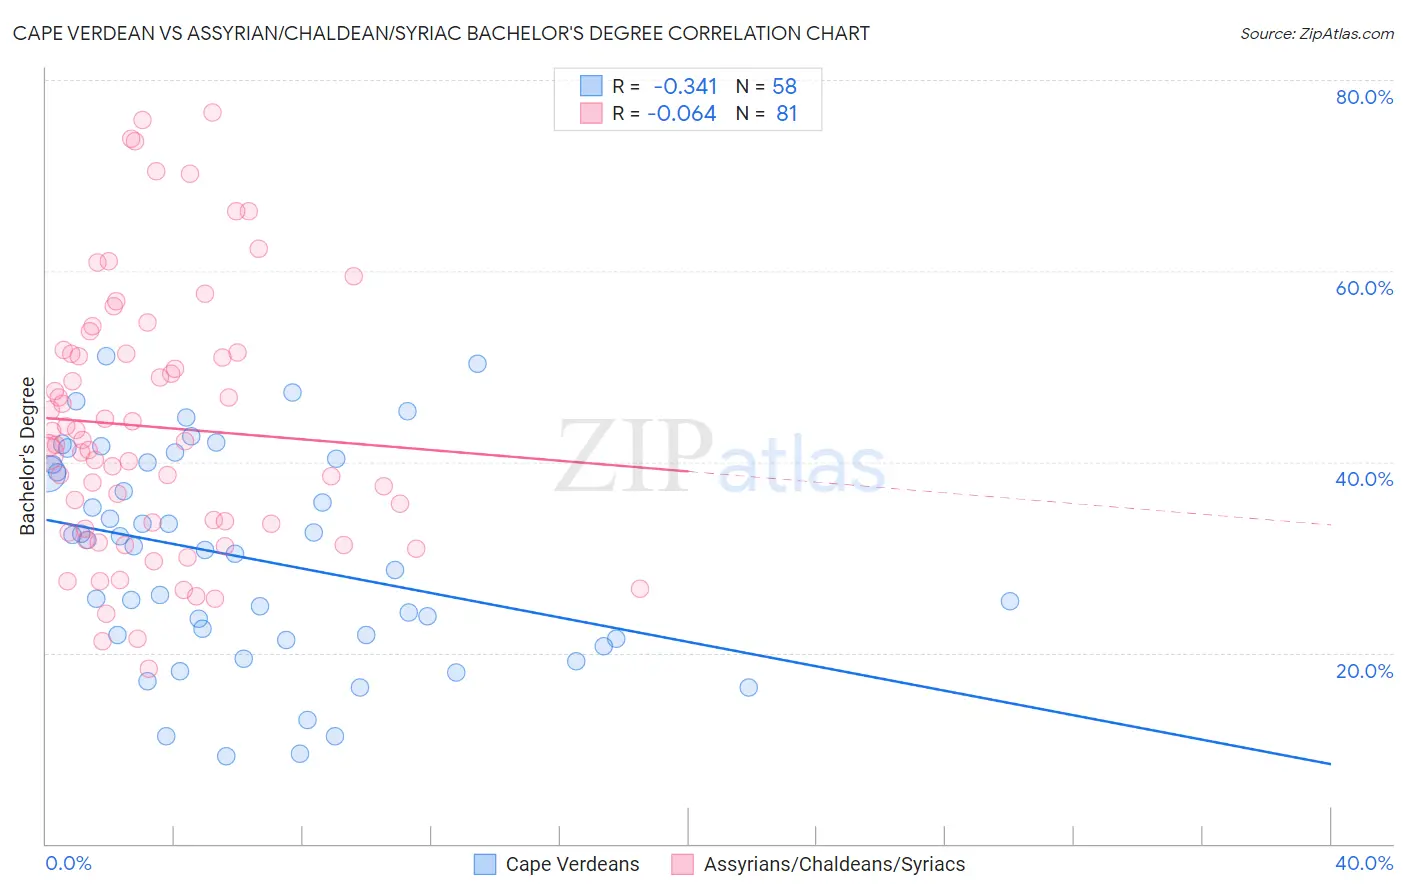
Cape Verdean vs Assyrian/Chaldean/Syriac Bachelor's Degree Correlation Chart
The statistical analysis conducted on geographies consisting of 107,579,192 people shows a mild negative correlation between the proportion of Cape Verdeans and percentage of population with at least bachelor's degree education in the United States with a correlation coefficient (R) of -0.341 and weighted average of 30.9%. Similarly, the statistical analysis conducted on geographies consisting of 110,314,164 people shows a slight negative correlation between the proportion of Assyrians/Chaldeans/Syriacs and percentage of population with at least bachelor's degree education in the United States with a correlation coefficient (R) of -0.064 and weighted average of 39.8%, a difference of 28.9%.
Bachelor's Degree Correlation Summary
| Measurement | Cape Verdean | Assyrian/Chaldean/Syriac |
| Minimum | 9.1% | 18.3% |
| Maximum | 51.0% | 76.7% |
| Range | 41.9% | 58.4% |
| Mean | 29.9% | 43.7% |
| Median | 31.0% | 41.8% |
| Interquartile 25% (IQ1) | 21.5% | 32.8% |
| Interquartile 75% (IQ3) | 39.7% | 51.4% |
| Interquartile Range (IQR) | 18.2% | 18.6% |
| Standard Deviation (Sample) | 11.0% | 13.8% |
| Standard Deviation (Population) | 10.9% | 13.7% |
Similar Demographics by Bachelor's Degree
Demographics Similar to Cape Verdeans by Bachelor's Degree
In terms of bachelor's degree, the demographic groups most similar to Cape Verdeans are Ute (30.9%, a difference of 0.090%), Black/African American (30.9%, a difference of 0.18%), Immigrants from Honduras (30.9%, a difference of 0.21%), Puerto Rican (31.0%, a difference of 0.26%), and Guatemalan (31.0%, a difference of 0.40%).
| Demographics | Rating | Rank | Bachelor's Degree |
| Immigrants | El Salvador | 0.1 /100 | #286 | Tragic 31.3% |
| Ottawa | 0.1 /100 | #287 | Tragic 31.1% |
| Guatemalans | 0.1 /100 | #288 | Tragic 31.0% |
| Puerto Ricans | 0.1 /100 | #289 | Tragic 31.0% |
| Immigrants | Honduras | 0.1 /100 | #290 | Tragic 30.9% |
| Blacks/African Americans | 0.1 /100 | #291 | Tragic 30.9% |
| Ute | 0.1 /100 | #292 | Tragic 30.9% |
| Cape Verdeans | 0.1 /100 | #293 | Tragic 30.9% |
| Immigrants | Guatemala | 0.0 /100 | #294 | Tragic 30.8% |
| Immigrants | Dominican Republic | 0.0 /100 | #295 | Tragic 30.7% |
| Puget Sound Salish | 0.0 /100 | #296 | Tragic 30.7% |
| Immigrants | Haiti | 0.0 /100 | #297 | Tragic 30.6% |
| Chippewa | 0.0 /100 | #298 | Tragic 30.6% |
| Chickasaw | 0.0 /100 | #299 | Tragic 30.4% |
| Immigrants | Micronesia | 0.0 /100 | #300 | Tragic 30.4% |
Demographics Similar to Assyrians/Chaldeans/Syriacs by Bachelor's Degree
In terms of bachelor's degree, the demographic groups most similar to Assyrians/Chaldeans/Syriacs are Luxembourger (39.8%, a difference of 0.080%), Pakistani (39.7%, a difference of 0.28%), Immigrants from Southern Europe (40.0%, a difference of 0.43%), Taiwanese (40.0%, a difference of 0.44%), and Icelander (39.5%, a difference of 0.65%).
| Demographics | Rating | Rank | Bachelor's Degree |
| Immigrants | Jordan | 93.4 /100 | #127 | Exceptional 40.3% |
| Immigrants | Venezuela | 92.9 /100 | #128 | Exceptional 40.2% |
| Serbians | 92.4 /100 | #129 | Exceptional 40.1% |
| Sierra Leoneans | 92.2 /100 | #130 | Exceptional 40.1% |
| Italians | 91.9 /100 | #131 | Exceptional 40.1% |
| Taiwanese | 91.1 /100 | #132 | Exceptional 40.0% |
| Immigrants | Southern Europe | 91.1 /100 | #133 | Exceptional 40.0% |
| Assyrians/Chaldeans/Syriacs | 89.4 /100 | #134 | Excellent 39.8% |
| Luxembourgers | 89.1 /100 | #135 | Excellent 39.8% |
| Pakistanis | 88.2 /100 | #136 | Excellent 39.7% |
| Icelanders | 86.5 /100 | #137 | Excellent 39.5% |
| Europeans | 85.6 /100 | #138 | Excellent 39.5% |
| Immigrants | Sudan | 84.5 /100 | #139 | Excellent 39.4% |
| Immigrants | Armenia | 84.1 /100 | #140 | Excellent 39.4% |
| South American Indians | 83.6 /100 | #141 | Excellent 39.3% |