Cape Verdean vs Ethiopian College, 1 year or more
COMPARE
Cape Verdean
Ethiopian
College, 1 year or more
College, 1 year or more Comparison
Cape Verdeans
Ethiopians
50.3%
COLLEGE, 1 YEAR OR MORE
0.0/ 100
METRIC RATING
329th/ 347
METRIC RANK
62.9%
COLLEGE, 1 YEAR OR MORE
98.8/ 100
METRIC RATING
77th/ 347
METRIC RANK
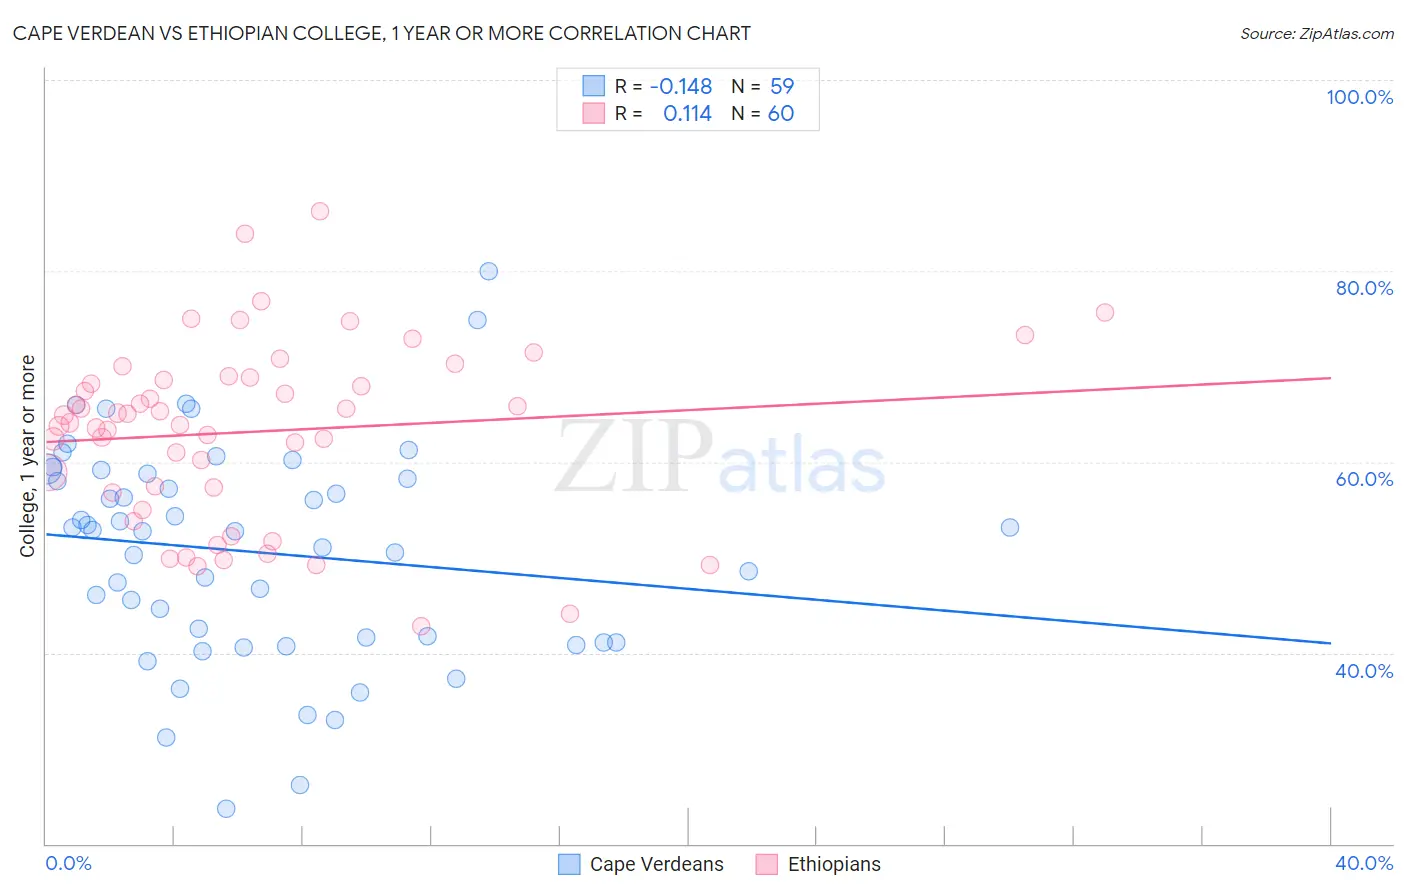
Cape Verdean vs Ethiopian College, 1 year or more Correlation Chart
The statistical analysis conducted on geographies consisting of 107,580,652 people shows a poor negative correlation between the proportion of Cape Verdeans and percentage of population with at least college, 1 year or more education in the United States with a correlation coefficient (R) of -0.148 and weighted average of 50.3%. Similarly, the statistical analysis conducted on geographies consisting of 223,259,495 people shows a poor positive correlation between the proportion of Ethiopians and percentage of population with at least college, 1 year or more education in the United States with a correlation coefficient (R) of 0.114 and weighted average of 62.9%, a difference of 25.1%.
College, 1 year or more Correlation Summary
| Measurement | Cape Verdean | Ethiopian |
| Minimum | 23.7% | 42.8% |
| Maximum | 79.9% | 86.2% |
| Range | 56.2% | 43.5% |
| Mean | 50.6% | 63.2% |
| Median | 52.7% | 64.5% |
| Interquartile 25% (IQ1) | 41.1% | 57.1% |
| Interquartile 75% (IQ3) | 58.8% | 68.7% |
| Interquartile Range (IQR) | 17.7% | 11.6% |
| Standard Deviation (Sample) | 11.4% | 9.3% |
| Standard Deviation (Population) | 11.3% | 9.2% |
Similar Demographics by College, 1 year or more
Demographics Similar to Cape Verdeans by College, 1 year or more
In terms of college, 1 year or more, the demographic groups most similar to Cape Verdeans are Native/Alaskan (50.2%, a difference of 0.22%), Dutch West Indian (50.5%, a difference of 0.39%), Menominee (50.6%, a difference of 0.51%), Dominican (50.6%, a difference of 0.55%), and Immigrants from Yemen (50.0%, a difference of 0.57%).
| Demographics | Rating | Rank | College, 1 year or more |
| Navajo | 0.0 /100 | #322 | Tragic 50.8% |
| Immigrants | Guatemala | 0.0 /100 | #323 | Tragic 50.7% |
| Immigrants | Cuba | 0.0 /100 | #324 | Tragic 50.7% |
| Immigrants | Latin America | 0.0 /100 | #325 | Tragic 50.7% |
| Dominicans | 0.0 /100 | #326 | Tragic 50.6% |
| Menominee | 0.0 /100 | #327 | Tragic 50.6% |
| Dutch West Indians | 0.0 /100 | #328 | Tragic 50.5% |
| Cape Verdeans | 0.0 /100 | #329 | Tragic 50.3% |
| Natives/Alaskans | 0.0 /100 | #330 | Tragic 50.2% |
| Immigrants | Yemen | 0.0 /100 | #331 | Tragic 50.0% |
| Mexicans | 0.0 /100 | #332 | Tragic 49.2% |
| Immigrants | Dominican Republic | 0.0 /100 | #333 | Tragic 49.1% |
| Lumbee | 0.0 /100 | #334 | Tragic 48.9% |
| Yuman | 0.0 /100 | #335 | Tragic 48.7% |
| Spanish American Indians | 0.0 /100 | #336 | Tragic 48.5% |
Demographics Similar to Ethiopians by College, 1 year or more
In terms of college, 1 year or more, the demographic groups most similar to Ethiopians are Paraguayan (62.9%, a difference of 0.0%), Immigrants from Lebanon (62.9%, a difference of 0.020%), Northern European (62.9%, a difference of 0.030%), Lithuanian (62.9%, a difference of 0.070%), and Armenian (63.0%, a difference of 0.10%).
| Demographics | Rating | Rank | College, 1 year or more |
| Argentineans | 99.2 /100 | #70 | Exceptional 63.2% |
| Immigrants | Canada | 99.1 /100 | #71 | Exceptional 63.1% |
| Egyptians | 99.0 /100 | #72 | Exceptional 63.1% |
| Immigrants | Moldova | 99.0 /100 | #73 | Exceptional 63.0% |
| Immigrants | North America | 99.0 /100 | #74 | Exceptional 63.0% |
| Armenians | 98.9 /100 | #75 | Exceptional 63.0% |
| Paraguayans | 98.8 /100 | #76 | Exceptional 62.9% |
| Ethiopians | 98.8 /100 | #77 | Exceptional 62.9% |
| Immigrants | Lebanon | 98.8 /100 | #78 | Exceptional 62.9% |
| Northern Europeans | 98.8 /100 | #79 | Exceptional 62.9% |
| Lithuanians | 98.8 /100 | #80 | Exceptional 62.9% |
| Laotians | 98.7 /100 | #81 | Exceptional 62.8% |
| Immigrants | Bolivia | 98.7 /100 | #82 | Exceptional 62.8% |
| Immigrants | Argentina | 98.6 /100 | #83 | Exceptional 62.8% |
| Immigrants | England | 98.6 /100 | #84 | Exceptional 62.8% |