Canadian vs Immigrants from Japan GED/Equivalency
COMPARE
Canadian
Immigrants from Japan
GED/Equivalency
GED/Equivalency Comparison
Canadians
Immigrants from Japan
87.1%
GED/EQUIVALENCY
95.6/ 100
METRIC RATING
108th/ 347
METRIC RANK
88.4%
GED/EQUIVALENCY
99.7/ 100
METRIC RATING
34th/ 347
METRIC RANK
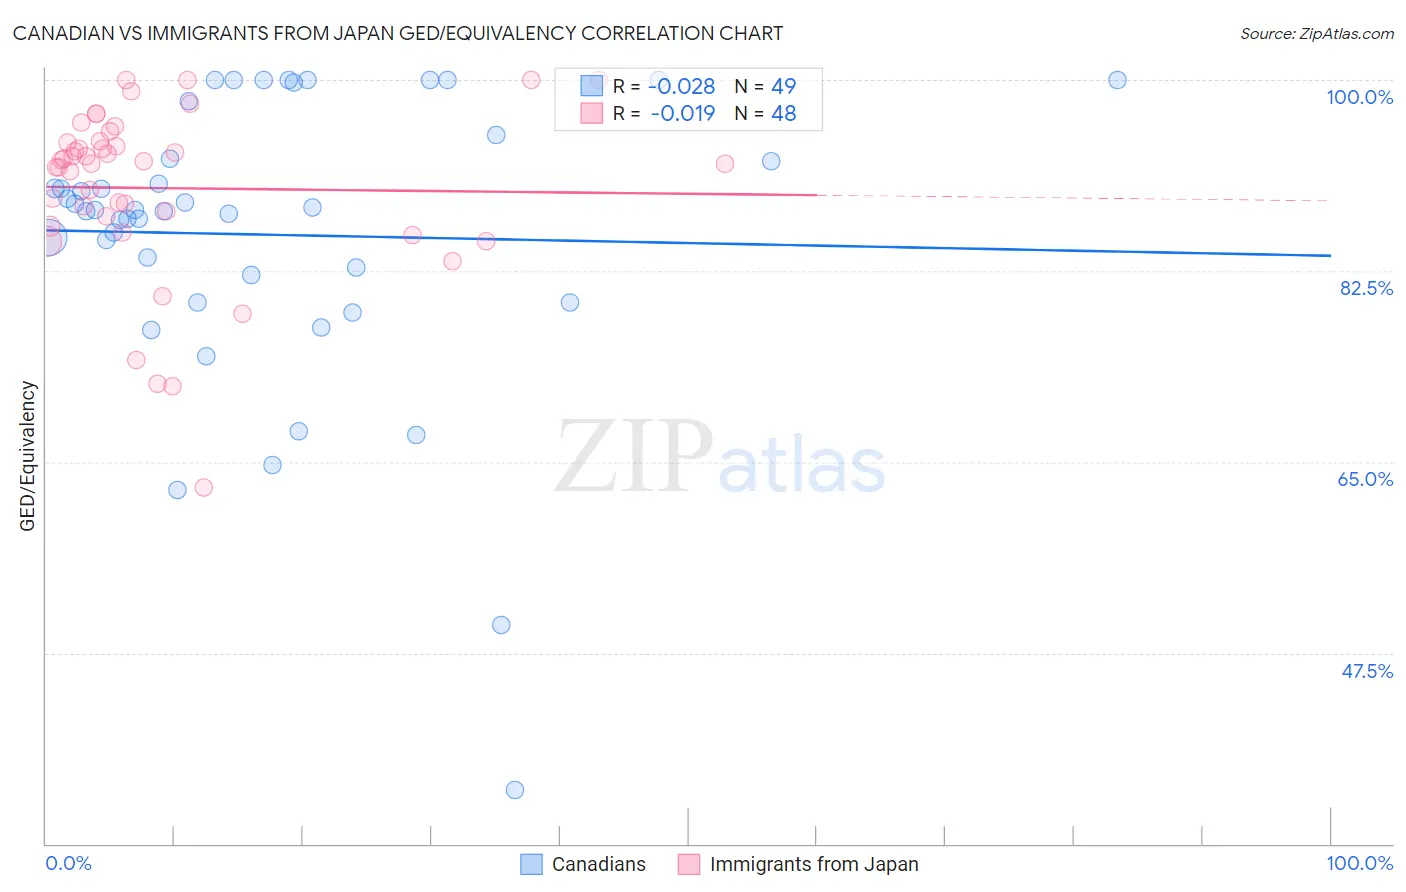
Canadian vs Immigrants from Japan GED/Equivalency Correlation Chart
The statistical analysis conducted on geographies consisting of 437,556,595 people shows no correlation between the proportion of Canadians and percentage of population with at least ged/equivalency education in the United States with a correlation coefficient (R) of -0.028 and weighted average of 87.1%. Similarly, the statistical analysis conducted on geographies consisting of 340,148,851 people shows no correlation between the proportion of Immigrants from Japan and percentage of population with at least ged/equivalency education in the United States with a correlation coefficient (R) of -0.019 and weighted average of 88.4%, a difference of 1.5%.
GED/Equivalency Correlation Summary
| Measurement | Canadian | Immigrants from Japan |
| Minimum | 34.9% | 62.7% |
| Maximum | 100.0% | 100.0% |
| Range | 65.1% | 37.3% |
| Mean | 85.8% | 90.1% |
| Median | 88.1% | 92.4% |
| Interquartile 25% (IQ1) | 80.9% | 87.1% |
| Interquartile 75% (IQ3) | 93.9% | 94.3% |
| Interquartile Range (IQR) | 13.0% | 7.2% |
| Standard Deviation (Sample) | 13.3% | 7.9% |
| Standard Deviation (Population) | 13.1% | 7.8% |
Similar Demographics by GED/Equivalency
Demographics Similar to Canadians by GED/Equivalency
In terms of ged/equivalency, the demographic groups most similar to Canadians are Immigrants from Eastern Europe (87.1%, a difference of 0.010%), Icelander (87.1%, a difference of 0.020%), Immigrants from Zimbabwe (87.1%, a difference of 0.030%), Indian (Asian) (87.1%, a difference of 0.040%), and Egyptian (87.1%, a difference of 0.040%).
| Demographics | Rating | Rank | GED/Equivalency |
| Syrians | 96.6 /100 | #101 | Exceptional 87.2% |
| Lebanese | 96.2 /100 | #102 | Exceptional 87.2% |
| Jordanians | 96.1 /100 | #103 | Exceptional 87.2% |
| Immigrants | Hungary | 96.0 /100 | #104 | Exceptional 87.2% |
| Indians (Asian) | 95.9 /100 | #105 | Exceptional 87.1% |
| Immigrants | Zimbabwe | 95.8 /100 | #106 | Exceptional 87.1% |
| Icelanders | 95.7 /100 | #107 | Exceptional 87.1% |
| Canadians | 95.6 /100 | #108 | Exceptional 87.1% |
| Immigrants | Eastern Europe | 95.5 /100 | #109 | Exceptional 87.1% |
| Egyptians | 95.3 /100 | #110 | Exceptional 87.1% |
| French | 95.2 /100 | #111 | Exceptional 87.1% |
| Tlingit-Haida | 94.8 /100 | #112 | Exceptional 87.0% |
| Assyrians/Chaldeans/Syriacs | 94.8 /100 | #113 | Exceptional 87.0% |
| Immigrants | Kazakhstan | 94.7 /100 | #114 | Exceptional 87.0% |
| Mongolians | 94.6 /100 | #115 | Exceptional 87.0% |
Demographics Similar to Immigrants from Japan by GED/Equivalency
In terms of ged/equivalency, the demographic groups most similar to Immigrants from Japan are Immigrants from Sweden (88.4%, a difference of 0.010%), Immigrants from South Central Asia (88.4%, a difference of 0.020%), Immigrants from Belgium (88.3%, a difference of 0.040%), Danish (88.4%, a difference of 0.050%), and Bhutanese (88.4%, a difference of 0.070%).
| Demographics | Rating | Rank | GED/Equivalency |
| Immigrants | Lithuania | 99.8 /100 | #27 | Exceptional 88.6% |
| Immigrants | Northern Europe | 99.8 /100 | #28 | Exceptional 88.5% |
| Poles | 99.8 /100 | #29 | Exceptional 88.5% |
| Turks | 99.8 /100 | #30 | Exceptional 88.5% |
| Bhutanese | 99.8 /100 | #31 | Exceptional 88.4% |
| Danes | 99.8 /100 | #32 | Exceptional 88.4% |
| Immigrants | Sweden | 99.7 /100 | #33 | Exceptional 88.4% |
| Immigrants | Japan | 99.7 /100 | #34 | Exceptional 88.4% |
| Immigrants | South Central Asia | 99.7 /100 | #35 | Exceptional 88.4% |
| Immigrants | Belgium | 99.7 /100 | #36 | Exceptional 88.3% |
| Immigrants | Austria | 99.7 /100 | #37 | Exceptional 88.3% |
| Burmese | 99.7 /100 | #38 | Exceptional 88.3% |
| Immigrants | Israel | 99.6 /100 | #39 | Exceptional 88.2% |
| Italians | 99.6 /100 | #40 | Exceptional 88.2% |
| Finns | 99.6 /100 | #41 | Exceptional 88.2% |