Immigrants from Belgium vs New Zealander High School Diploma
COMPARE
Immigrants from Belgium
New Zealander
High School Diploma
High School Diploma Comparison
Immigrants from Belgium
New Zealanders
91.1%
HIGH SCHOOL DIPLOMA
99.7/ 100
METRIC RATING
53rd/ 347
METRIC RANK
91.1%
HIGH SCHOOL DIPLOMA
99.7/ 100
METRIC RATING
51st/ 347
METRIC RANK
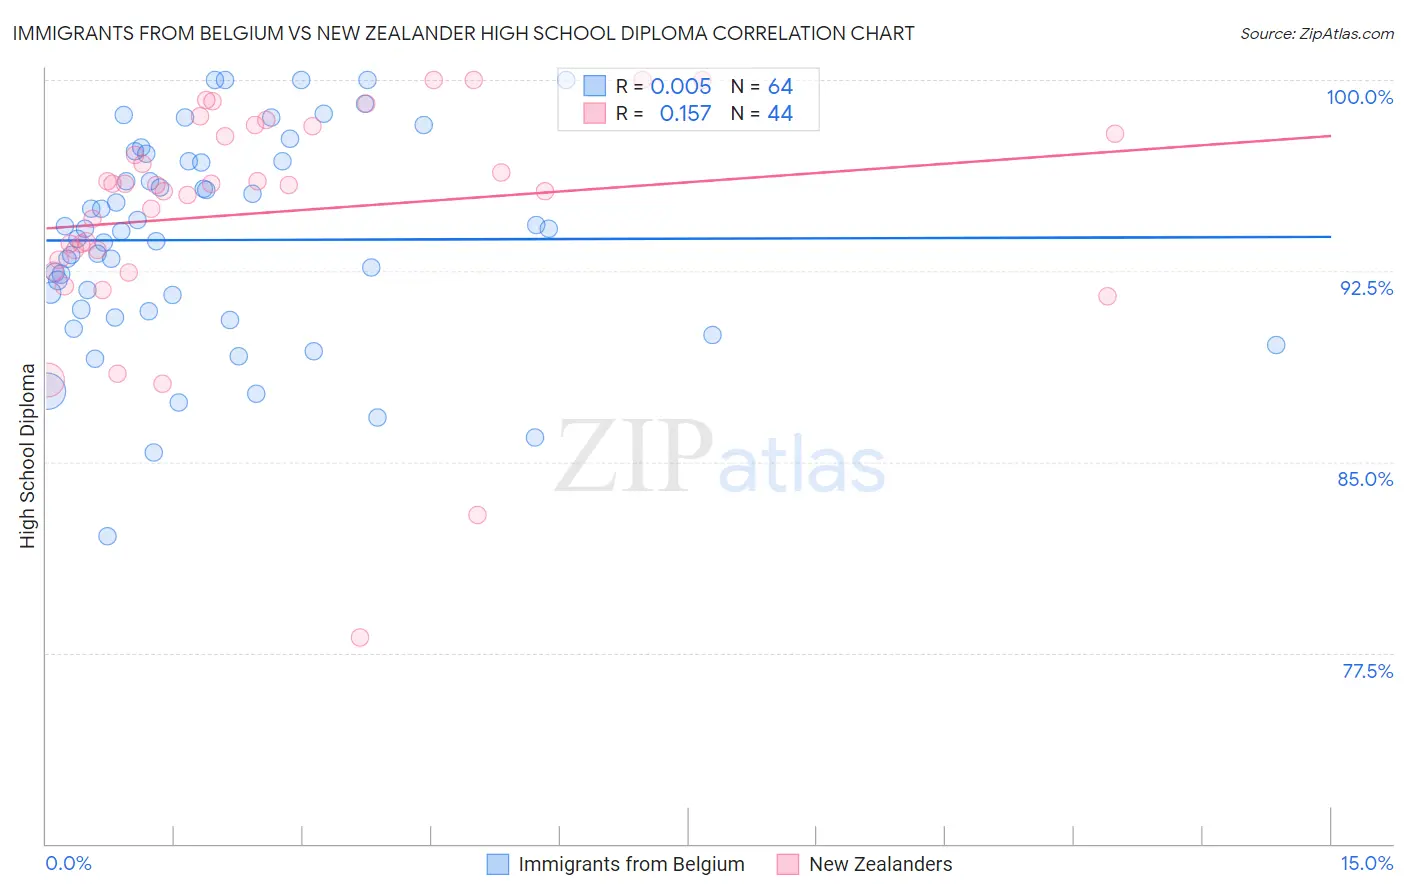
Immigrants from Belgium vs New Zealander High School Diploma Correlation Chart
The statistical analysis conducted on geographies consisting of 146,727,159 people shows no correlation between the proportion of Immigrants from Belgium and percentage of population with at least high school diploma education in the United States with a correlation coefficient (R) of 0.005 and weighted average of 91.1%. Similarly, the statistical analysis conducted on geographies consisting of 106,912,544 people shows a poor positive correlation between the proportion of New Zealanders and percentage of population with at least high school diploma education in the United States with a correlation coefficient (R) of 0.157 and weighted average of 91.1%, a difference of 0.0%.
High School Diploma Correlation Summary
| Measurement | Immigrants from Belgium | New Zealander |
| Minimum | 82.1% | 78.1% |
| Maximum | 100.0% | 100.0% |
| Range | 17.9% | 21.9% |
| Mean | 93.7% | 94.8% |
| Median | 94.1% | 95.9% |
| Interquartile 25% (IQ1) | 91.0% | 93.1% |
| Interquartile 75% (IQ3) | 96.8% | 98.0% |
| Interquartile Range (IQR) | 5.8% | 4.9% |
| Standard Deviation (Sample) | 4.1% | 4.5% |
| Standard Deviation (Population) | 4.0% | 4.4% |
Demographics Similar to Immigrants from Belgium and New Zealanders by High School Diploma
In terms of high school diploma, the demographic groups most similar to Immigrants from Belgium are Immigrants from Sweden (91.1%, a difference of 0.0%), Macedonian (91.1%, a difference of 0.020%), Serbian (91.1%, a difference of 0.030%), Welsh (91.2%, a difference of 0.050%), and Immigrants from Canada (91.1%, a difference of 0.060%). Similarly, the demographic groups most similar to New Zealanders are Immigrants from Sweden (91.1%, a difference of 0.0%), Macedonian (91.1%, a difference of 0.020%), Serbian (91.1%, a difference of 0.040%), Welsh (91.2%, a difference of 0.050%), and Bhutanese (91.2%, a difference of 0.060%).
| Demographics | Rating | Rank | High School Diploma |
| Northern Europeans | 99.8 /100 | #42 | Exceptional 91.3% |
| British | 99.8 /100 | #43 | Exceptional 91.3% |
| Immigrants | Austria | 99.8 /100 | #44 | Exceptional 91.3% |
| Turks | 99.8 /100 | #45 | Exceptional 91.2% |
| Greeks | 99.8 /100 | #46 | Exceptional 91.2% |
| Australians | 99.8 /100 | #47 | Exceptional 91.2% |
| Belgians | 99.8 /100 | #48 | Exceptional 91.2% |
| Bhutanese | 99.8 /100 | #49 | Exceptional 91.2% |
| Welsh | 99.8 /100 | #50 | Exceptional 91.2% |
| New Zealanders | 99.7 /100 | #51 | Exceptional 91.1% |
| Immigrants | Sweden | 99.7 /100 | #52 | Exceptional 91.1% |
| Immigrants | Belgium | 99.7 /100 | #53 | Exceptional 91.1% |
| Macedonians | 99.7 /100 | #54 | Exceptional 91.1% |
| Serbians | 99.7 /100 | #55 | Exceptional 91.1% |
| Immigrants | Canada | 99.7 /100 | #56 | Exceptional 91.1% |
| Zimbabweans | 99.7 /100 | #57 | Exceptional 91.1% |
| Slavs | 99.7 /100 | #58 | Exceptional 91.0% |
| Immigrants | North America | 99.7 /100 | #59 | Exceptional 91.0% |
| Immigrants | Japan | 99.6 /100 | #60 | Exceptional 91.0% |
| Immigrants | Taiwan | 99.6 /100 | #61 | Exceptional 91.0% |
| Austrians | 99.6 /100 | #62 | Exceptional 91.0% |