Cambodian vs Immigrants from Philippines High School Diploma
COMPARE
Cambodian
Immigrants from Philippines
High School Diploma
High School Diploma Comparison
Cambodians
Immigrants from Philippines
90.8%
HIGH SCHOOL DIPLOMA
99.4/ 100
METRIC RATING
75th/ 347
METRIC RANK
87.8%
HIGH SCHOOL DIPLOMA
1.9/ 100
METRIC RATING
243rd/ 347
METRIC RANK
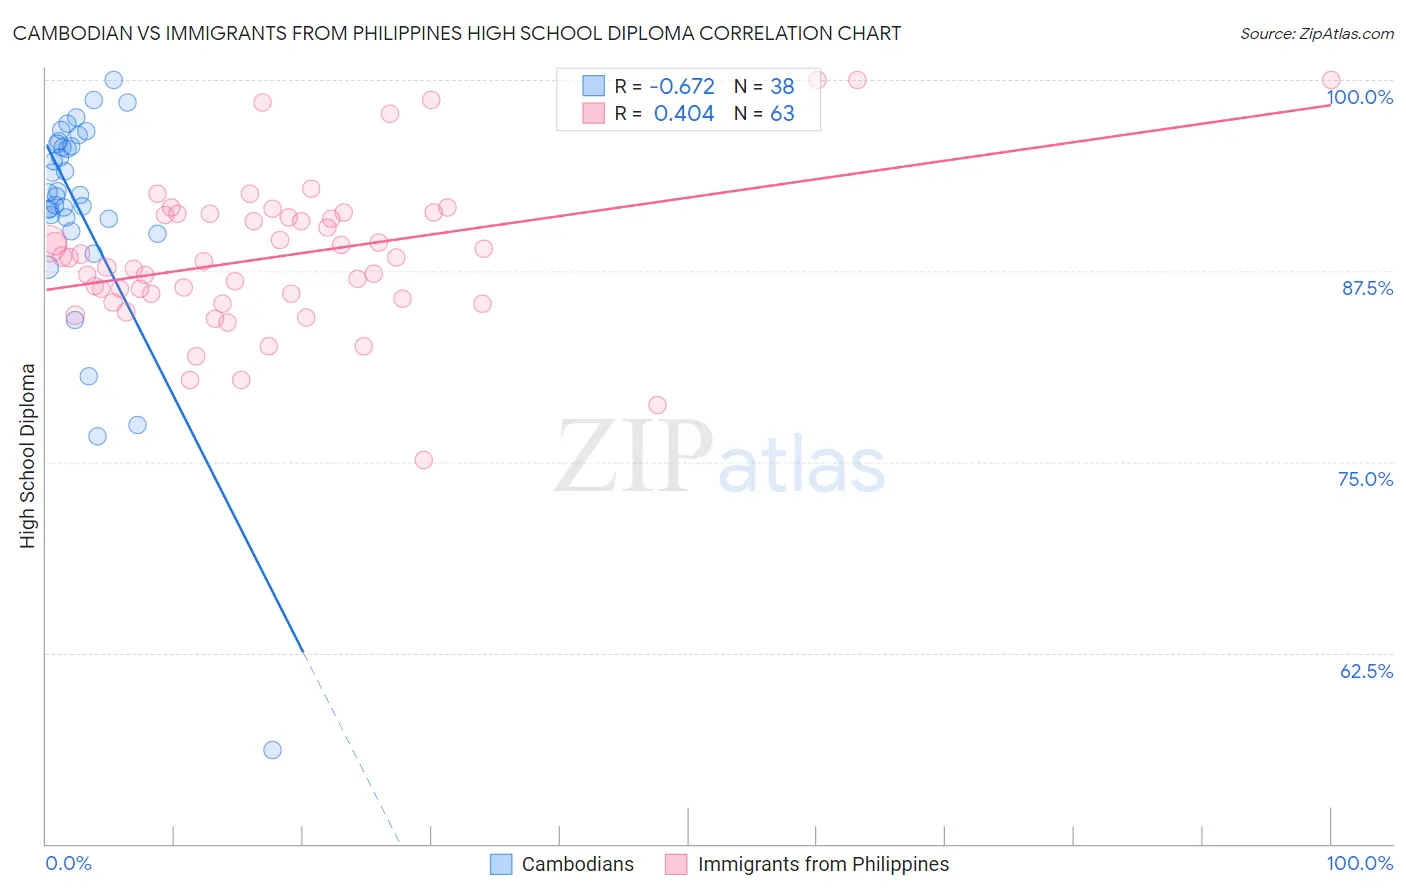
Cambodian vs Immigrants from Philippines High School Diploma Correlation Chart
The statistical analysis conducted on geographies consisting of 102,514,976 people shows a significant negative correlation between the proportion of Cambodians and percentage of population with at least high school diploma education in the United States with a correlation coefficient (R) of -0.672 and weighted average of 90.8%. Similarly, the statistical analysis conducted on geographies consisting of 471,300,535 people shows a moderate positive correlation between the proportion of Immigrants from Philippines and percentage of population with at least high school diploma education in the United States with a correlation coefficient (R) of 0.404 and weighted average of 87.8%, a difference of 3.4%.
High School Diploma Correlation Summary
| Measurement | Cambodian | Immigrants from Philippines |
| Minimum | 56.1% | 75.1% |
| Maximum | 100.0% | 100.0% |
| Range | 43.9% | 24.9% |
| Mean | 91.3% | 88.5% |
| Median | 92.6% | 88.3% |
| Interquartile 25% (IQ1) | 90.9% | 85.7% |
| Interquartile 75% (IQ3) | 95.8% | 91.2% |
| Interquartile Range (IQR) | 4.9% | 5.6% |
| Standard Deviation (Sample) | 7.9% | 5.0% |
| Standard Deviation (Population) | 7.8% | 4.9% |
Similar Demographics by High School Diploma
Demographics Similar to Cambodians by High School Diploma
In terms of high school diploma, the demographic groups most similar to Cambodians are Hungarian (90.8%, a difference of 0.010%), Immigrants from South Central Asia (90.9%, a difference of 0.020%), Immigrants from Czechoslovakia (90.9%, a difference of 0.020%), Native Hawaiian (90.8%, a difference of 0.020%), and Burmese (90.8%, a difference of 0.020%).
| Demographics | Rating | Rank | High School Diploma |
| Czechoslovakians | 99.5 /100 | #68 | Exceptional 90.9% |
| French Canadians | 99.5 /100 | #69 | Exceptional 90.9% |
| Immigrants | Latvia | 99.5 /100 | #70 | Exceptional 90.9% |
| Alaskan Athabascans | 99.4 /100 | #71 | Exceptional 90.9% |
| Soviet Union | 99.4 /100 | #72 | Exceptional 90.9% |
| Immigrants | South Central Asia | 99.4 /100 | #73 | Exceptional 90.9% |
| Immigrants | Czechoslovakia | 99.4 /100 | #74 | Exceptional 90.9% |
| Cambodians | 99.4 /100 | #75 | Exceptional 90.8% |
| Hungarians | 99.3 /100 | #76 | Exceptional 90.8% |
| Native Hawaiians | 99.3 /100 | #77 | Exceptional 90.8% |
| Burmese | 99.3 /100 | #78 | Exceptional 90.8% |
| Immigrants | Denmark | 99.3 /100 | #79 | Exceptional 90.8% |
| Immigrants | England | 99.3 /100 | #80 | Exceptional 90.8% |
| Immigrants | Switzerland | 99.3 /100 | #81 | Exceptional 90.8% |
| Scotch-Irish | 99.2 /100 | #82 | Exceptional 90.8% |
Demographics Similar to Immigrants from Philippines by High School Diploma
In terms of high school diploma, the demographic groups most similar to Immigrants from Philippines are Choctaw (87.8%, a difference of 0.0%), Peruvian (87.8%, a difference of 0.010%), Immigrants from Uzbekistan (87.8%, a difference of 0.020%), Cheyenne (87.8%, a difference of 0.020%), and Comanche (87.9%, a difference of 0.050%).
| Demographics | Rating | Rank | High School Diploma |
| Sub-Saharan Africans | 2.8 /100 | #236 | Tragic 87.9% |
| Taiwanese | 2.8 /100 | #237 | Tragic 87.9% |
| Sioux | 2.7 /100 | #238 | Tragic 87.9% |
| South Americans | 2.7 /100 | #239 | Tragic 87.9% |
| Comanche | 2.2 /100 | #240 | Tragic 87.9% |
| Immigrants | Uzbekistan | 2.1 /100 | #241 | Tragic 87.8% |
| Cheyenne | 2.1 /100 | #242 | Tragic 87.8% |
| Immigrants | Philippines | 1.9 /100 | #243 | Tragic 87.8% |
| Choctaw | 1.9 /100 | #244 | Tragic 87.8% |
| Peruvians | 1.9 /100 | #245 | Tragic 87.8% |
| Immigrants | Eritrea | 1.7 /100 | #246 | Tragic 87.8% |
| Immigrants | Costa Rica | 1.7 /100 | #247 | Tragic 87.8% |
| Spanish Americans | 1.5 /100 | #248 | Tragic 87.7% |
| Senegalese | 1.5 /100 | #249 | Tragic 87.7% |
| Immigrants | Nigeria | 1.5 /100 | #250 | Tragic 87.7% |