Cambodian vs Houma High School Diploma
COMPARE
Cambodian
Houma
High School Diploma
High School Diploma Comparison
Cambodians
Houma
90.8%
HIGH SCHOOL DIPLOMA
99.4/ 100
METRIC RATING
75th/ 347
METRIC RANK
81.5%
HIGH SCHOOL DIPLOMA
0.0/ 100
METRIC RATING
340th/ 347
METRIC RANK
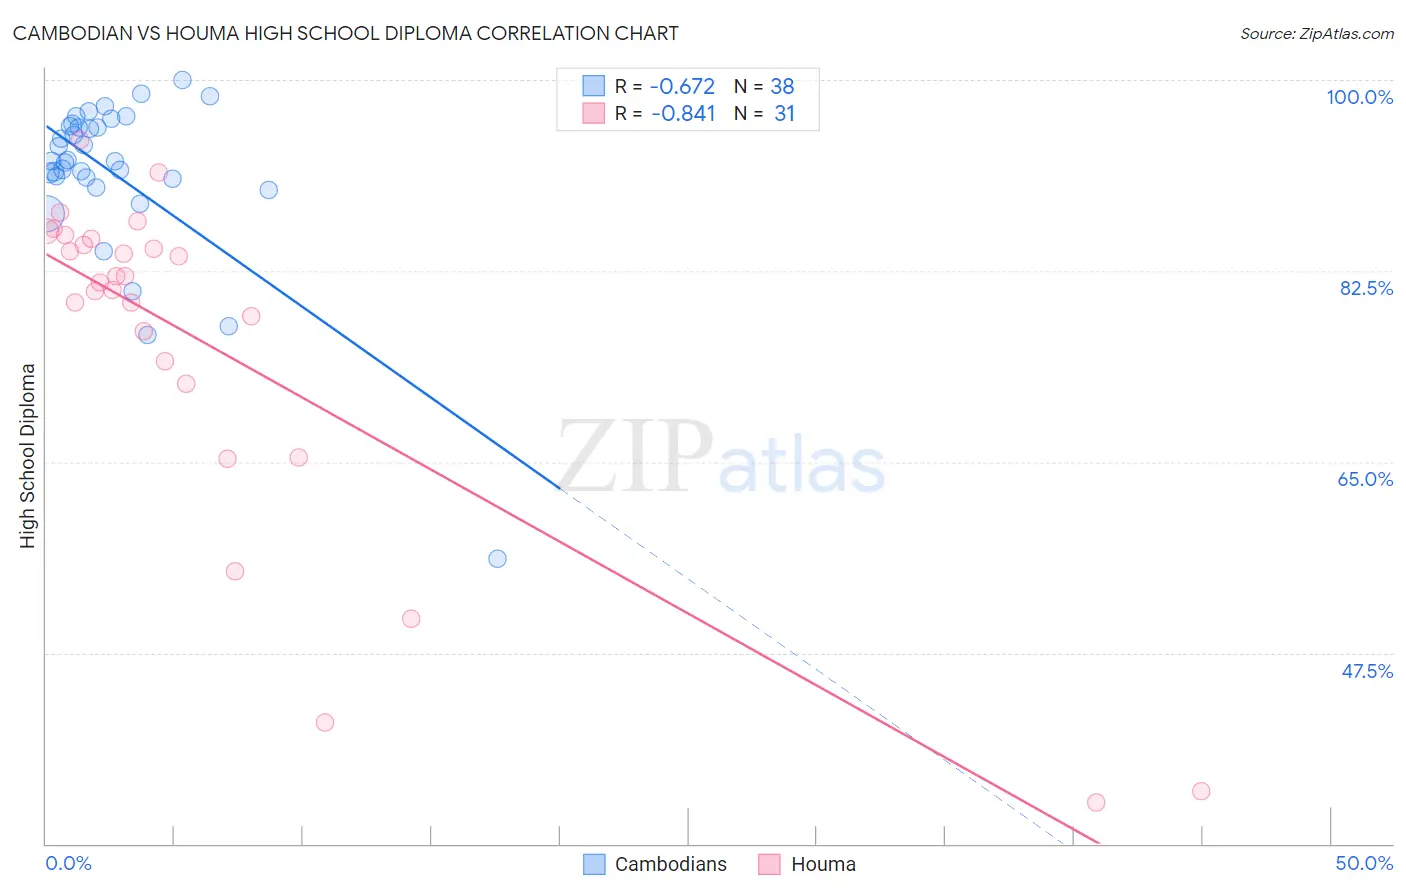
Cambodian vs Houma High School Diploma Correlation Chart
The statistical analysis conducted on geographies consisting of 102,514,976 people shows a significant negative correlation between the proportion of Cambodians and percentage of population with at least high school diploma education in the United States with a correlation coefficient (R) of -0.672 and weighted average of 90.8%. Similarly, the statistical analysis conducted on geographies consisting of 36,795,916 people shows a very strong negative correlation between the proportion of Houma and percentage of population with at least high school diploma education in the United States with a correlation coefficient (R) of -0.841 and weighted average of 81.5%, a difference of 11.4%.
High School Diploma Correlation Summary
| Measurement | Cambodian | Houma |
| Minimum | 56.1% | 33.8% |
| Maximum | 100.0% | 94.5% |
| Range | 43.9% | 60.8% |
| Mean | 91.3% | 75.5% |
| Median | 92.6% | 81.4% |
| Interquartile 25% (IQ1) | 90.9% | 72.2% |
| Interquartile 75% (IQ3) | 95.8% | 85.4% |
| Interquartile Range (IQR) | 4.9% | 13.2% |
| Standard Deviation (Sample) | 7.9% | 16.1% |
| Standard Deviation (Population) | 7.8% | 15.9% |
Similar Demographics by High School Diploma
Demographics Similar to Cambodians by High School Diploma
In terms of high school diploma, the demographic groups most similar to Cambodians are Hungarian (90.8%, a difference of 0.010%), Immigrants from South Central Asia (90.9%, a difference of 0.020%), Immigrants from Czechoslovakia (90.9%, a difference of 0.020%), Native Hawaiian (90.8%, a difference of 0.020%), and Burmese (90.8%, a difference of 0.020%).
| Demographics | Rating | Rank | High School Diploma |
| Czechoslovakians | 99.5 /100 | #68 | Exceptional 90.9% |
| French Canadians | 99.5 /100 | #69 | Exceptional 90.9% |
| Immigrants | Latvia | 99.5 /100 | #70 | Exceptional 90.9% |
| Alaskan Athabascans | 99.4 /100 | #71 | Exceptional 90.9% |
| Soviet Union | 99.4 /100 | #72 | Exceptional 90.9% |
| Immigrants | South Central Asia | 99.4 /100 | #73 | Exceptional 90.9% |
| Immigrants | Czechoslovakia | 99.4 /100 | #74 | Exceptional 90.9% |
| Cambodians | 99.4 /100 | #75 | Exceptional 90.8% |
| Hungarians | 99.3 /100 | #76 | Exceptional 90.8% |
| Native Hawaiians | 99.3 /100 | #77 | Exceptional 90.8% |
| Burmese | 99.3 /100 | #78 | Exceptional 90.8% |
| Immigrants | Denmark | 99.3 /100 | #79 | Exceptional 90.8% |
| Immigrants | England | 99.3 /100 | #80 | Exceptional 90.8% |
| Immigrants | Switzerland | 99.3 /100 | #81 | Exceptional 90.8% |
| Scotch-Irish | 99.2 /100 | #82 | Exceptional 90.8% |
Demographics Similar to Houma by High School Diploma
In terms of high school diploma, the demographic groups most similar to Houma are Pima (81.6%, a difference of 0.11%), Mexican (81.4%, a difference of 0.15%), Salvadoran (81.7%, a difference of 0.20%), Immigrants from Guatemala (81.4%, a difference of 0.20%), and Immigrants from Yemen (81.8%, a difference of 0.38%).
| Demographics | Rating | Rank | High School Diploma |
| Immigrants | Latin America | 0.0 /100 | #333 | Tragic 82.1% |
| Tohono O'odham | 0.0 /100 | #334 | Tragic 82.1% |
| Guatemalans | 0.0 /100 | #335 | Tragic 82.0% |
| Immigrants | Dominican Republic | 0.0 /100 | #336 | Tragic 82.0% |
| Immigrants | Yemen | 0.0 /100 | #337 | Tragic 81.8% |
| Salvadorans | 0.0 /100 | #338 | Tragic 81.7% |
| Pima | 0.0 /100 | #339 | Tragic 81.6% |
| Houma | 0.0 /100 | #340 | Tragic 81.5% |
| Mexicans | 0.0 /100 | #341 | Tragic 81.4% |
| Immigrants | Guatemala | 0.0 /100 | #342 | Tragic 81.4% |
| Immigrants | El Salvador | 0.0 /100 | #343 | Tragic 80.8% |
| Immigrants | Central America | 0.0 /100 | #344 | Tragic 80.1% |
| Yakama | 0.0 /100 | #345 | Tragic 80.0% |
| Spanish American Indians | 0.0 /100 | #346 | Tragic 79.8% |
| Immigrants | Mexico | 0.0 /100 | #347 | Tragic 79.5% |