Cambodian vs Alaskan Athabascan High School Diploma
COMPARE
Cambodian
Alaskan Athabascan
High School Diploma
High School Diploma Comparison
Cambodians
Alaskan Athabascans
90.8%
HIGH SCHOOL DIPLOMA
99.4/ 100
METRIC RATING
75th/ 347
METRIC RANK
90.9%
HIGH SCHOOL DIPLOMA
99.4/ 100
METRIC RATING
71st/ 347
METRIC RANK
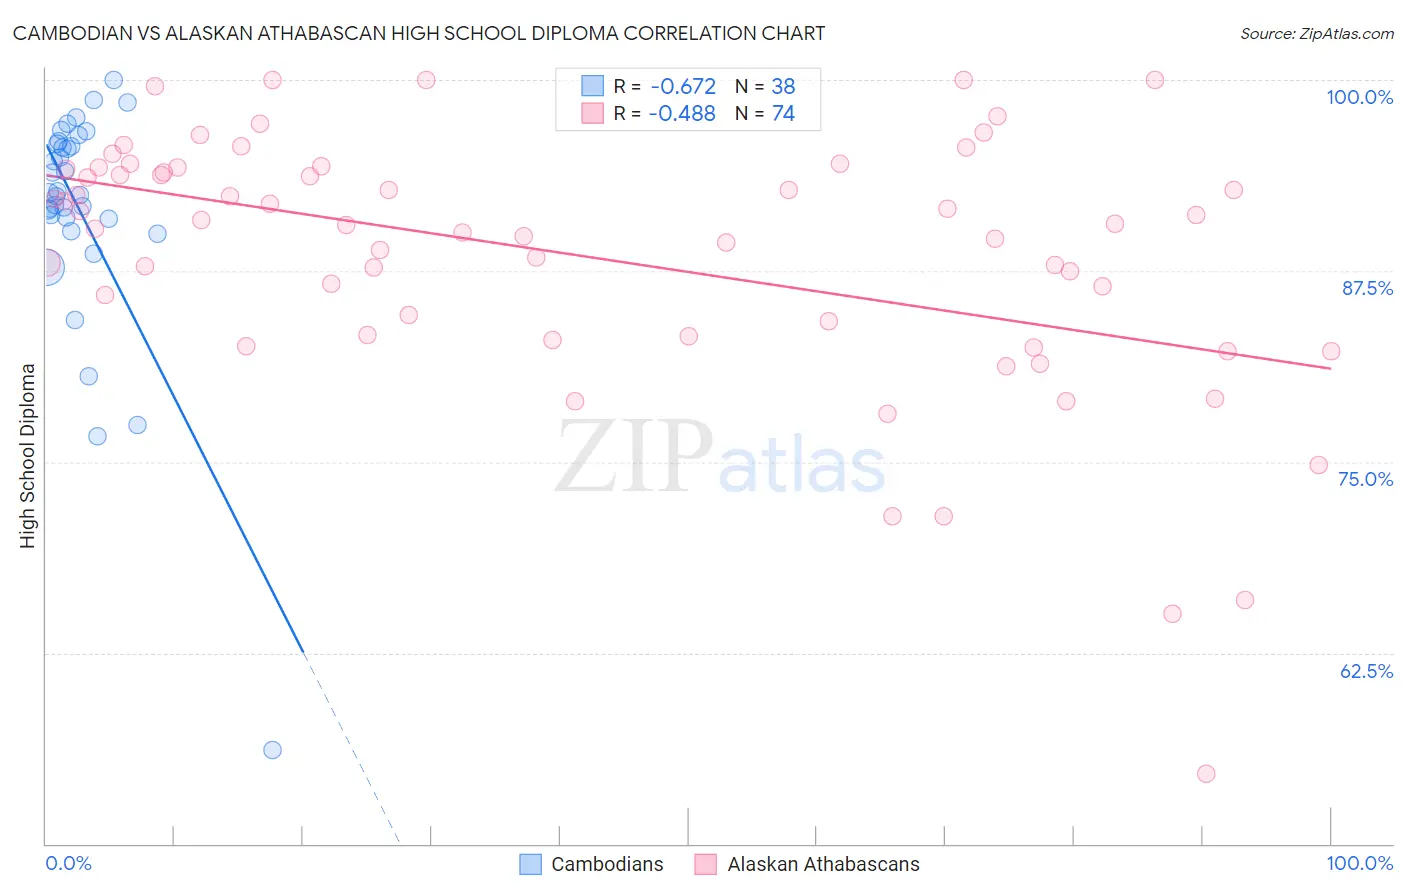
Cambodian vs Alaskan Athabascan High School Diploma Correlation Chart
The statistical analysis conducted on geographies consisting of 102,514,976 people shows a significant negative correlation between the proportion of Cambodians and percentage of population with at least high school diploma education in the United States with a correlation coefficient (R) of -0.672 and weighted average of 90.8%. Similarly, the statistical analysis conducted on geographies consisting of 45,820,221 people shows a moderate negative correlation between the proportion of Alaskan Athabascans and percentage of population with at least high school diploma education in the United States with a correlation coefficient (R) of -0.488 and weighted average of 90.9%, a difference of 0.050%.
High School Diploma Correlation Summary
| Measurement | Cambodian | Alaskan Athabascan |
| Minimum | 56.1% | 54.5% |
| Maximum | 100.0% | 100.0% |
| Range | 43.9% | 45.5% |
| Mean | 91.3% | 88.4% |
| Median | 92.6% | 90.5% |
| Interquartile 25% (IQ1) | 90.9% | 83.3% |
| Interquartile 75% (IQ3) | 95.8% | 94.2% |
| Interquartile Range (IQR) | 4.9% | 10.9% |
| Standard Deviation (Sample) | 7.9% | 8.6% |
| Standard Deviation (Population) | 7.8% | 8.5% |
Demographics Similar to Cambodians and Alaskan Athabascans by High School Diploma
In terms of high school diploma, the demographic groups most similar to Cambodians are Hungarian (90.8%, a difference of 0.010%), Immigrants from South Central Asia (90.9%, a difference of 0.020%), Immigrants from Czechoslovakia (90.9%, a difference of 0.020%), Native Hawaiian (90.8%, a difference of 0.020%), and Burmese (90.8%, a difference of 0.020%). Similarly, the demographic groups most similar to Alaskan Athabascans are Immigrants from Latvia (90.9%, a difference of 0.0%), Soviet Union (90.9%, a difference of 0.0%), French Canadian (90.9%, a difference of 0.010%), Immigrants from South Central Asia (90.9%, a difference of 0.030%), and Czechoslovakian (90.9%, a difference of 0.040%).
| Demographics | Rating | Rank | High School Diploma |
| Immigrants | Netherlands | 99.6 /100 | #63 | Exceptional 91.0% |
| Ukrainians | 99.6 /100 | #64 | Exceptional 91.0% |
| Immigrants | South Africa | 99.6 /100 | #65 | Exceptional 91.0% |
| French | 99.5 /100 | #66 | Exceptional 91.0% |
| Immigrants | Iran | 99.5 /100 | #67 | Exceptional 90.9% |
| Czechoslovakians | 99.5 /100 | #68 | Exceptional 90.9% |
| French Canadians | 99.5 /100 | #69 | Exceptional 90.9% |
| Immigrants | Latvia | 99.5 /100 | #70 | Exceptional 90.9% |
| Alaskan Athabascans | 99.4 /100 | #71 | Exceptional 90.9% |
| Soviet Union | 99.4 /100 | #72 | Exceptional 90.9% |
| Immigrants | South Central Asia | 99.4 /100 | #73 | Exceptional 90.9% |
| Immigrants | Czechoslovakia | 99.4 /100 | #74 | Exceptional 90.9% |
| Cambodians | 99.4 /100 | #75 | Exceptional 90.8% |
| Hungarians | 99.3 /100 | #76 | Exceptional 90.8% |
| Native Hawaiians | 99.3 /100 | #77 | Exceptional 90.8% |
| Burmese | 99.3 /100 | #78 | Exceptional 90.8% |
| Immigrants | Denmark | 99.3 /100 | #79 | Exceptional 90.8% |
| Immigrants | England | 99.3 /100 | #80 | Exceptional 90.8% |
| Immigrants | Switzerland | 99.3 /100 | #81 | Exceptional 90.8% |
| Scotch-Irish | 99.2 /100 | #82 | Exceptional 90.8% |
| Immigrants | Moldova | 99.2 /100 | #83 | Exceptional 90.7% |