Cajun vs Bermudan Doctorate Degree
COMPARE
Cajun
Bermudan
Doctorate Degree
Doctorate Degree Comparison
Cajuns
Bermudans
1.5%
DOCTORATE DEGREE
0.3/ 100
METRIC RATING
287th/ 347
METRIC RANK
1.8%
DOCTORATE DEGREE
52.1/ 100
METRIC RATING
171st/ 347
METRIC RANK
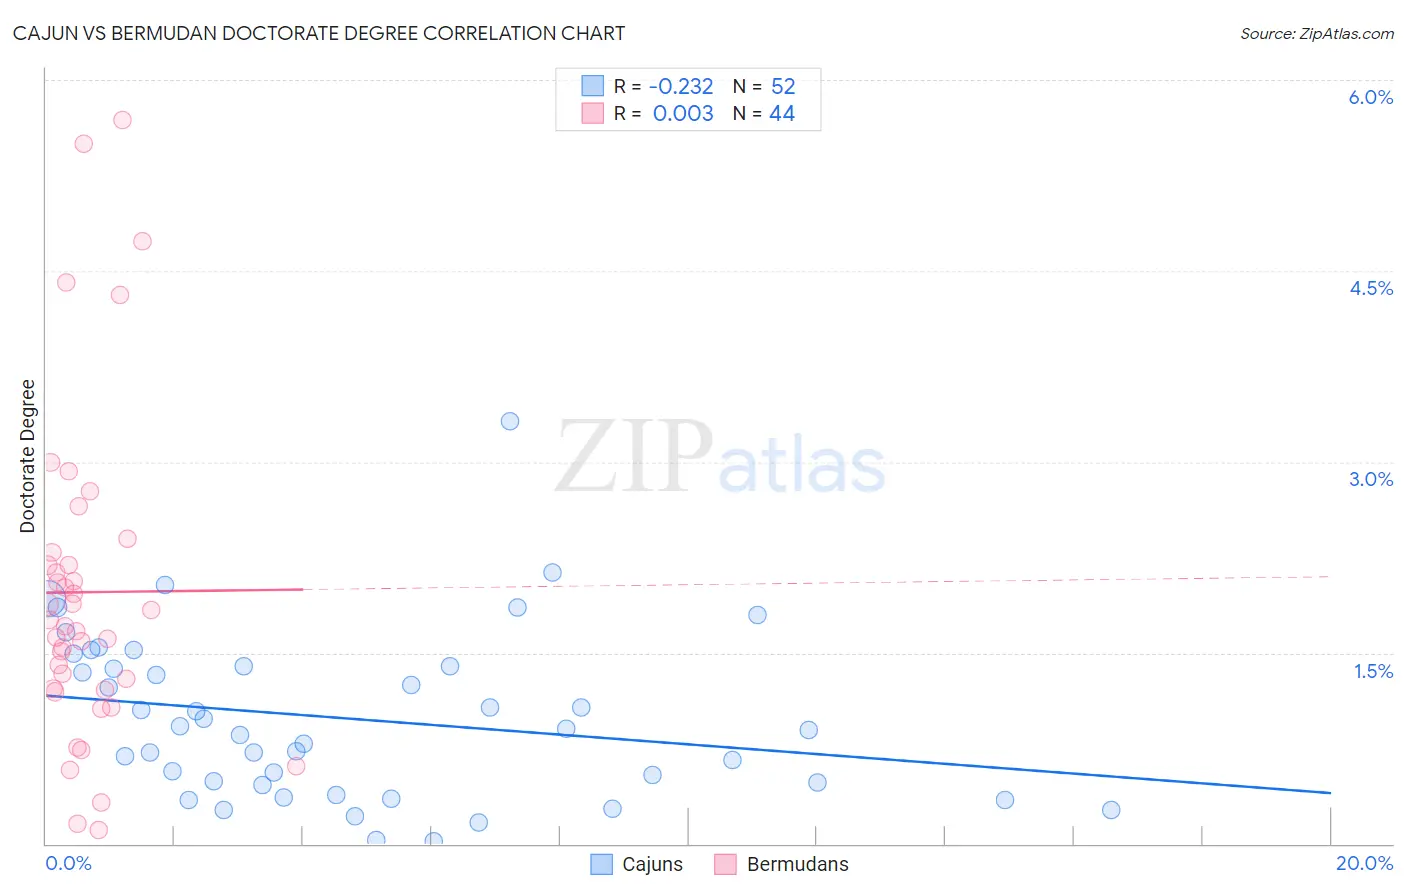
Cajun vs Bermudan Doctorate Degree Correlation Chart
The statistical analysis conducted on geographies consisting of 148,318,310 people shows a weak negative correlation between the proportion of Cajuns and percentage of population with at least doctorate degree education in the United States with a correlation coefficient (R) of -0.232 and weighted average of 1.5%. Similarly, the statistical analysis conducted on geographies consisting of 55,683,142 people shows no correlation between the proportion of Bermudans and percentage of population with at least doctorate degree education in the United States with a correlation coefficient (R) of 0.003 and weighted average of 1.8%, a difference of 27.2%.
Doctorate Degree Correlation Summary
| Measurement | Cajun | Bermudan |
| Minimum | 0.021% | 0.10% |
| Maximum | 3.3% | 5.7% |
| Range | 3.3% | 5.6% |
| Mean | 0.98% | 2.0% |
| Median | 0.90% | 1.7% |
| Interquartile 25% (IQ1) | 0.47% | 1.2% |
| Interquartile 75% (IQ3) | 1.4% | 2.2% |
| Interquartile Range (IQR) | 0.92% | 1.0% |
| Standard Deviation (Sample) | 0.65% | 1.3% |
| Standard Deviation (Population) | 0.65% | 1.3% |
Similar Demographics by Doctorate Degree
Demographics Similar to Cajuns by Doctorate Degree
In terms of doctorate degree, the demographic groups most similar to Cajuns are Cherokee (1.5%, a difference of 0.17%), Immigrants from El Salvador (1.4%, a difference of 0.18%), Cape Verdean (1.4%, a difference of 0.31%), Choctaw (1.4%, a difference of 0.33%), and Malaysian (1.5%, a difference of 0.34%).
| Demographics | Rating | Rank | Doctorate Degree |
| Ecuadorians | 0.4 /100 | #280 | Tragic 1.5% |
| Tohono O'odham | 0.4 /100 | #281 | Tragic 1.5% |
| British West Indians | 0.3 /100 | #282 | Tragic 1.5% |
| Central Americans | 0.3 /100 | #283 | Tragic 1.5% |
| Jamaicans | 0.3 /100 | #284 | Tragic 1.5% |
| Malaysians | 0.3 /100 | #285 | Tragic 1.5% |
| Cherokee | 0.3 /100 | #286 | Tragic 1.5% |
| Cajuns | 0.3 /100 | #287 | Tragic 1.5% |
| Immigrants | El Salvador | 0.3 /100 | #288 | Tragic 1.4% |
| Cape Verdeans | 0.3 /100 | #289 | Tragic 1.4% |
| Choctaw | 0.3 /100 | #290 | Tragic 1.4% |
| Blacks/African Americans | 0.3 /100 | #291 | Tragic 1.4% |
| Alaska Natives | 0.3 /100 | #292 | Tragic 1.4% |
| Immigrants | Yemen | 0.2 /100 | #293 | Tragic 1.4% |
| Samoans | 0.2 /100 | #294 | Tragic 1.4% |
Demographics Similar to Bermudans by Doctorate Degree
In terms of doctorate degree, the demographic groups most similar to Bermudans are Costa Rican (1.8%, a difference of 0.17%), Belgian (1.8%, a difference of 0.27%), Norwegian (1.8%, a difference of 0.31%), Immigrants from Bangladesh (1.8%, a difference of 0.31%), and Vietnamese (1.9%, a difference of 0.39%).
| Demographics | Rating | Rank | Doctorate Degree |
| Celtics | 66.7 /100 | #164 | Good 1.9% |
| Scotch-Irish | 63.6 /100 | #165 | Good 1.9% |
| Spaniards | 63.5 /100 | #166 | Good 1.9% |
| Macedonians | 60.9 /100 | #167 | Good 1.9% |
| Sri Lankans | 60.3 /100 | #168 | Good 1.9% |
| Vietnamese | 54.8 /100 | #169 | Average 1.9% |
| Costa Ricans | 53.3 /100 | #170 | Average 1.8% |
| Bermudans | 52.1 /100 | #171 | Average 1.8% |
| Belgians | 50.3 /100 | #172 | Average 1.8% |
| Norwegians | 50.0 /100 | #173 | Average 1.8% |
| Immigrants | Bangladesh | 50.0 /100 | #174 | Average 1.8% |
| Immigrants | Thailand | 49.4 /100 | #175 | Average 1.8% |
| Spanish | 49.3 /100 | #176 | Average 1.8% |
| Iraqis | 49.2 /100 | #177 | Average 1.8% |
| French | 48.8 /100 | #178 | Average 1.8% |