Cajun vs Immigrants from Norway Doctorate Degree

COMPARE

Cajun
Race
Ancestry
AfghanAfricanAlaska NativeAlaskan AthabascanAlbanianAleutAlsatianAmericanApacheArabArapahoArgentineanArmenianAssyrian/Chaldean/SyriacAustralianAustrianBahamianBangladeshiBarbadianBasqueBelgianBelizeanBermudanBhutaneseBlackfeetBolivianBrazilianBritishBritish West IndianBulgarianBurmeseCajunCambodianCanadianCape VerdeanCarpatho RusynCelticCentral AmericanCentral American IndianCherokeeCheyenneChickasawChileanChineseChippewaChoctawColombianColvilleComancheCosta RicanCreeCreekCroatianCrowCubanCypriotCzechCzechoslovakianDanishDelawareDominicanDutchDutch West IndianEastern EuropeanEcuadorianEgyptianEnglishEstonianEthiopianEuropeanFijianFilipinoFinnishFrenchFrench American IndianFrench CanadianGermanGerman RussianGhanaianGreekGuamanian/ChamorroGuatemalanGuyaneseHaitianHmongHonduranHopiHoumaHungarianIcelanderIndian (Asian)IndonesianInupiatIranianIraqiIrishIroquoisIsraeliItalianJamaicanJapaneseJordanianKenyanKiowaKoreanLaotianLatvianLebaneseLiberianLithuanianLumbeeLuxembourgerMacedonianMalaysianMalteseMarshalleseMenomineeMexicanMexican American IndianMongolianMoroccanNative HawaiianNavajoNepaleseNew ZealanderNicaraguanNigerianNorthern EuropeanNorwegianOkinawanOsageOttawaPaiutePakistaniPalestinianPanamanianParaguayanPennsylvania GermanPeruvianPimaPolishPortuguesePotawatomiPuebloPuerto RicanPuget Sound SalishRomanianRussianSalvadoranSamoanScandinavianScotch-IrishScottishSeminoleSenegaleseSerbianShoshoneSierra LeoneanSiouxSlavicSlovakSloveneSomaliSouth AfricanSouth AmericanSouth American IndianSoviet UnionSpaniardSpanishSpanish AmericanSpanish American IndianSri LankanSubsaharan AfricanSudaneseSwedishSwissSyrianTaiwaneseThaiTlingit-HaidaTohono O'OdhamTonganTrinidadian and TobagonianTsimshianTurkishU.S. Virgin IslanderUgandanUkrainianUruguayanUteVenezuelanVietnameseWelshWest IndianYakamaYaquiYugoslavianYumanYup'ikZimbabwean
Immigration
NonimmigrantsImmigrantsAfghanistanAfricaAlbaniaArgentinaArmeniaAsiaAustraliaAustriaBahamasBangladeshBarbadosBelarusBelgiumBelizeBoliviaBosnia and HerzegovinaBrazilBulgariaBurma/MyanmarCabo VerdeCambodiaCameroonCanadaCaribbeanCentral AmericaChileChinaColombiaCongoCosta RicaCroatiaCubaCzechoslovakiaDenmarkDominicaDominican RepublicEastern AfricaEastern AsiaEastern EuropeEcuadorEgyptEl SalvadorEnglandEritreaEthiopiaEuropeFijiFranceGermanyGhanaGreeceGrenadaGuatemalaGuyanaHaitiHondurasHong KongHungaryIndiaIndonesiaIranIraqIrelandIsraelItalyJamaicaJapanJordanKazakhstanKenyaKoreaKuwaitLaosLatin AmericaLatviaLebanonLiberiaLithuaniaMalaysiaMexicoMicronesiaMiddle AfricaMoldovaMoroccoNepalNetherlandsNicaraguaNigeriaNorth AmericaNorth MacedoniaNorthern AfricaNorthern EuropeOceaniaPakistanPanamaPeruPhilippinesPolandPortugalRomaniaRussiaSaudi ArabiaScotlandSenegalSerbiaSierra LeoneSingaporeSomaliaSouth AfricaSouth AmericaSouth Central AsiaSouth Eastern AsiaSouthern EuropeSpainSri LankaSt. Vincent and the GrenadinesSudanSwedenSwitzerlandSyriaTaiwanThailandTrinidad and TobagoTurkeyUgandaUkraineUruguayUzbekistanVenezuelaVietnamWest IndiesWestern AfricaWestern AsiaWestern EuropeYemenZaireZimbabweAzores
Immigrants from Norway
Race
Ancestry
AfghanAfricanAlaska NativeAlaskan AthabascanAlbanianAleutAlsatianAmericanApacheArabArapahoArgentineanArmenianAssyrian/Chaldean/SyriacAustralianAustrianBahamianBangladeshiBarbadianBasqueBelgianBelizeanBermudanBhutaneseBlackfeetBolivianBrazilianBritishBritish West IndianBulgarianBurmeseCambodianCanadianCape VerdeanCarpatho RusynCelticCentral AmericanCentral American IndianCherokeeCheyenneChickasawChileanChineseChippewaChoctawColombianColvilleComancheCosta RicanCreeCreekCroatianCrowCubanCypriotCzechCzechoslovakianDanishDelawareDominicanDutchDutch West IndianEastern EuropeanEcuadorianEgyptianEnglishEstonianEthiopianEuropeanFijianFilipinoFinnishFrenchFrench American IndianFrench CanadianGermanGerman RussianGhanaianGreekGuamanian/ChamorroGuatemalanGuyaneseHaitianHmongHonduranHopiHoumaHungarianIcelanderIndian (Asian)IndonesianInupiatIranianIraqiIrishIroquoisIsraeliItalianJamaicanJapaneseJordanianKenyanKiowaKoreanLaotianLatvianLebaneseLiberianLithuanianLumbeeLuxembourgerMacedonianMalaysianMalteseMarshalleseMenomineeMexicanMexican American IndianMongolianMoroccanNative HawaiianNavajoNepaleseNew ZealanderNicaraguanNigerianNorthern EuropeanNorwegianOkinawanOsageOttawaPaiutePakistaniPalestinianPanamanianParaguayanPennsylvania GermanPeruvianPimaPolishPortuguesePotawatomiPuebloPuerto RicanPuget Sound SalishRomanianRussianSalvadoranSamoanScandinavianScotch-IrishScottishSeminoleSenegaleseSerbianShoshoneSierra LeoneanSiouxSlavicSlovakSloveneSomaliSouth AfricanSouth AmericanSouth American IndianSoviet UnionSpaniardSpanishSpanish AmericanSpanish American IndianSri LankanSubsaharan AfricanSudaneseSwedishSwissSyrianTaiwaneseThaiTlingit-HaidaTohono O'OdhamTonganTrinidadian and TobagonianTsimshianTurkishU.S. Virgin IslanderUgandanUkrainianUruguayanUteVenezuelanVietnameseWelshWest IndianYakamaYaquiYugoslavianYumanYup'ikZimbabwean
Immigration
NonimmigrantsImmigrantsAfghanistanAfricaAlbaniaArgentinaArmeniaAsiaAustraliaAustriaBahamasBangladeshBarbadosBelarusBelgiumBelizeBoliviaBosnia and HerzegovinaBrazilBulgariaBurma/MyanmarCabo VerdeCambodiaCameroonCanadaCaribbeanCentral AmericaChileChinaColombiaCongoCosta RicaCroatiaCubaCzechoslovakiaDenmarkDominicaDominican RepublicEastern AfricaEastern AsiaEastern EuropeEcuadorEgyptEl SalvadorEnglandEritreaEthiopiaEuropeFijiFranceGermanyGhanaGreeceGrenadaGuatemalaGuyanaHaitiHondurasHong KongHungaryIndiaIndonesiaIranIraqIrelandIsraelItalyJamaicaJapanJordanKazakhstanKenyaKoreaKuwaitLaosLatin AmericaLatviaLebanonLiberiaLithuaniaMalaysiaMexicoMicronesiaMiddle AfricaMoldovaMoroccoNepalNetherlandsNicaraguaNigeriaNorth AmericaNorth MacedoniaNorthern AfricaNorthern EuropeNorwayOceaniaPakistanPanamaPeruPhilippinesPolandPortugalRomaniaRussiaSaudi ArabiaScotlandSenegalSerbiaSierra LeoneSingaporeSomaliaSouth AfricaSouth AmericaSouth Central AsiaSouth Eastern AsiaSouthern EuropeSpainSri LankaSt. Vincent and the GrenadinesSudanSwedenSwitzerlandSyriaTaiwanThailandTrinidad and TobagoTurkeyUgandaUkraineUruguayUzbekistanVenezuelaVietnamWest IndiesWestern AfricaWestern AsiaWestern EuropeYemenZaireZimbabweAzores
Doctorate Degree
Income
Poverty
Unemployment
Labor Participation
Family Structure
Vehicle Availability
Education Level
Disability

Doctorate Degree Comparison

Cajuns

Immigrants from Norway

Tragic
Exceptional
1.5%
DOCTORATE DEGREE
0.3/ 100
METRIC RATING
287th/ 347
METRIC RANK
2.4%
DOCTORATE DEGREE
100.0/ 100
METRIC RATING
50th/ 347
METRIC RANK

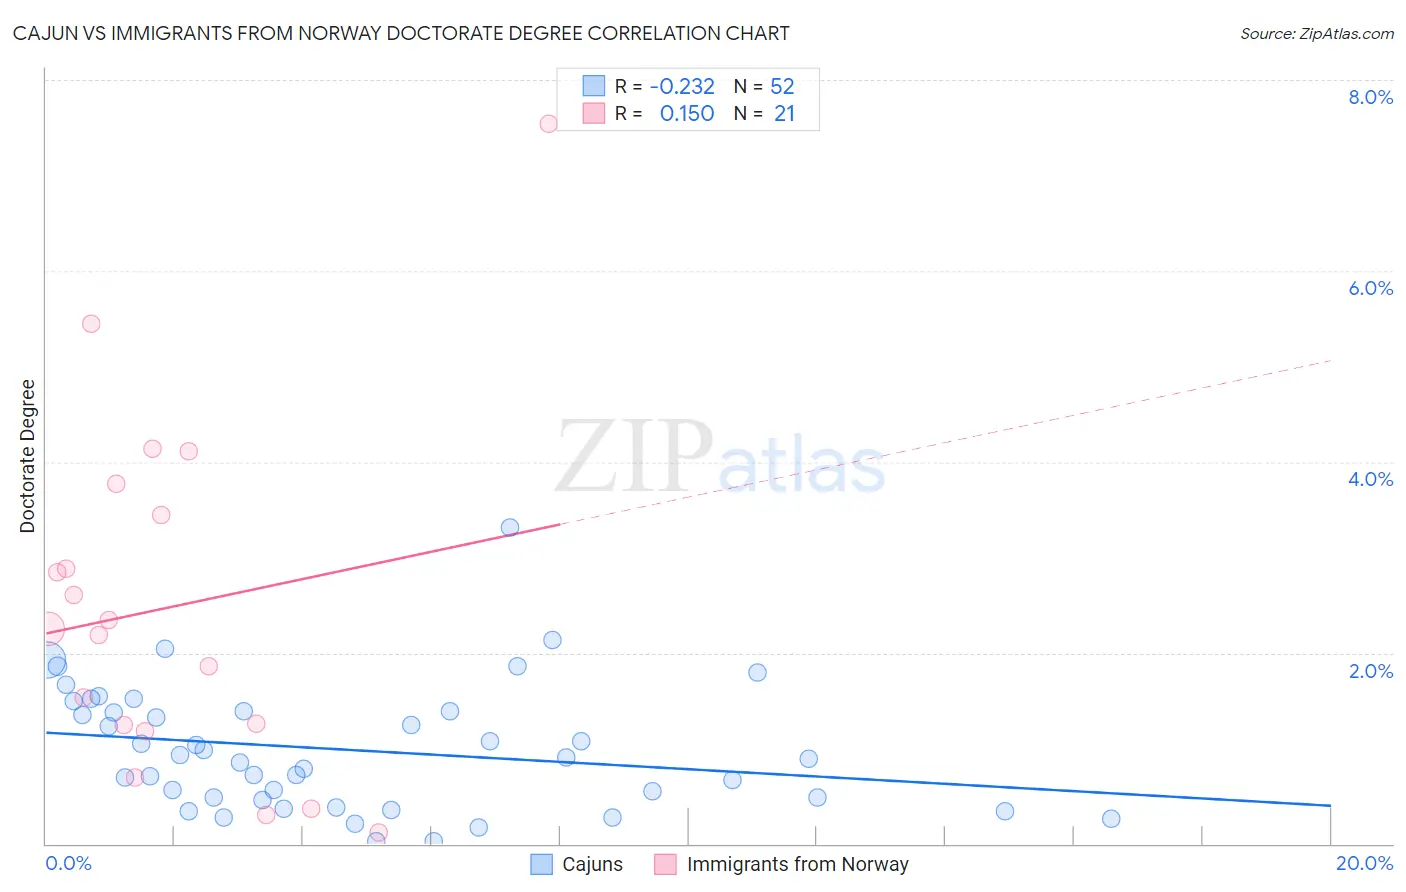
Cajun vs Immigrants from Norway Doctorate Degree Correlation Chart

The statistical analysis conducted on geographies consisting of 148,318,310 people shows a weak negative correlation between the proportion of Cajuns and percentage of population with at least doctorate degree education in the United States with a correlation coefficient (R) of -0.232 and weighted average of 1.5%. Similarly, the statistical analysis conducted on geographies consisting of 116,506,510 people shows a poor positive correlation between the proportion of Immigrants from Norway and percentage of population with at least doctorate degree education in the United States with a correlation coefficient (R) of 0.150 and weighted average of 2.4%, a difference of 65.4%.
Cajun vs Immigrants from Norway Doctorate Degree

Doctorate Degree Correlation Summary

MeasurementCajunImmigrants from Norway
Minimum0.021%0.12%
Maximum3.3%7.5%
Range3.3%7.4%
Mean0.98%2.5%
Median0.90%2.3%
Interquartile 25% (IQ1)0.47%1.2%
Interquartile 75% (IQ3)1.4%3.6%
Interquartile Range (IQR)0.92%2.4%
Standard Deviation (Sample)0.65%1.8%
Standard Deviation (Population)0.65%1.8%

Similar Demographics by Doctorate Degree

Demographics Similar to Cajuns by Doctorate Degree

In terms of doctorate degree, the demographic groups most similar to Cajuns are Cherokee (1.5%, a difference of 0.17%), Immigrants from El Salvador (1.4%, a difference of 0.18%), Cape Verdean (1.4%, a difference of 0.31%), Choctaw (1.4%, a difference of 0.33%), and Malaysian (1.5%, a difference of 0.34%).
DemographicsRating | RankDoctorate Degree
Ecuadorians
0.4
/100
|
#280
Tragic
1.5%
Tohono O'odham
0.4
/100
|
#281
Tragic
1.5%
British West Indians
0.3
/100
|
#282
Tragic
1.5%
Central Americans
0.3
/100
|
#283
Tragic
1.5%
Jamaicans
0.3
/100
|
#284
Tragic
1.5%
Malaysians
0.3
/100
|
#285
Tragic
1.5%
Cherokee
0.3
/100
|
#286
Tragic
1.5%
Cajuns
0.3
/100
|
#287
Tragic
1.5%
Immigrants | El Salvador
0.3
/100
|
#288
Tragic
1.4%
Cape Verdeans
0.3
/100
|
#289
Tragic
1.4%
Choctaw
0.3
/100
|
#290
Tragic
1.4%
Blacks/African Americans
0.3
/100
|
#291
Tragic
1.4%
Alaska Natives
0.3
/100
|
#292
Tragic
1.4%
Immigrants | Yemen
0.2
/100
|
#293
Tragic
1.4%
Samoans
0.2
/100
|
#294
Tragic
1.4%

Demographics Similar to Immigrants from Norway by Doctorate Degree

In terms of doctorate degree, the demographic groups most similar to Immigrants from Norway are Australian (2.4%, a difference of 0.090%), Bulgarian (2.4%, a difference of 0.56%), Immigrants from Latvia (2.4%, a difference of 0.68%), Immigrants from Asia (2.4%, a difference of 1.1%), and Asian (2.4%, a difference of 1.3%).
DemographicsRating | RankDoctorate Degree
Soviet Union
100.0
/100
|
#43
Exceptional
2.5%
Immigrants | Netherlands
100.0
/100
|
#44
Exceptional
2.5%
Immigrants | South Africa
100.0
/100
|
#45
Exceptional
2.4%
Immigrants | Austria
100.0
/100
|
#46
Exceptional
2.4%
Immigrants | Western Europe
100.0
/100
|
#47
Exceptional
2.4%
Asians
100.0
/100
|
#48
Exceptional
2.4%
Immigrants | Asia
100.0
/100
|
#49
Exceptional
2.4%
Immigrants | Norway
100.0
/100
|
#50
Exceptional
2.4%
Australians
100.0
/100
|
#51
Exceptional
2.4%
Bulgarians
100.0
/100
|
#52
Exceptional
2.4%
Immigrants | Latvia
100.0
/100
|
#53
Exceptional
2.4%
Immigrants | Indonesia
100.0
/100
|
#54
Exceptional
2.4%
Bolivians
100.0
/100
|
#55
Exceptional
2.4%
Immigrants | Czechoslovakia
100.0
/100
|
#56
Exceptional
2.4%
Immigrants | Ethiopia
100.0
/100
|
#57
Exceptional
2.4%