Cajun vs Hispanic or Latino Unemployment Among Ages 30 to 34 years
COMPARE
Cajun
Hispanic or Latino
Unemployment Among Ages 30 to 34 years
Unemployment Among Ages 30 to 34 years Comparison
Cajuns
Hispanics or Latinos
6.7%
UNEMPLOYMENT AMONG AGES 30 TO 34 YEARS
0.0/ 100
METRIC RATING
303rd/ 347
METRIC RANK
6.4%
UNEMPLOYMENT AMONG AGES 30 TO 34 YEARS
0.0/ 100
METRIC RATING
283rd/ 347
METRIC RANK
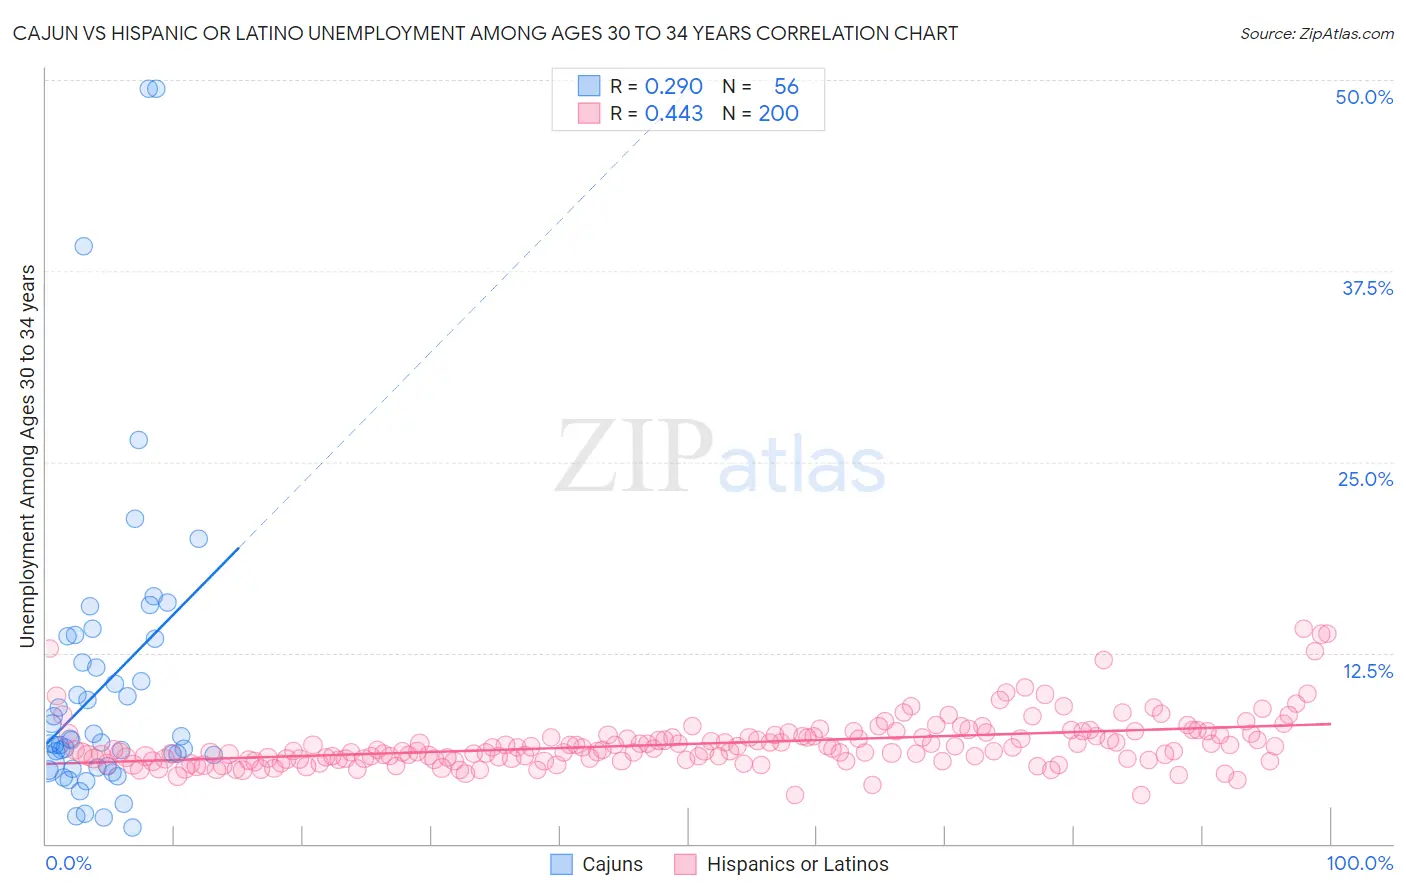
Cajun vs Hispanic or Latino Unemployment Among Ages 30 to 34 years Correlation Chart
The statistical analysis conducted on geographies consisting of 144,402,531 people shows a weak positive correlation between the proportion of Cajuns and unemployment rate among population between the ages 30 and 34 in the United States with a correlation coefficient (R) of 0.290 and weighted average of 6.7%. Similarly, the statistical analysis conducted on geographies consisting of 503,591,851 people shows a moderate positive correlation between the proportion of Hispanics or Latinos and unemployment rate among population between the ages 30 and 34 in the United States with a correlation coefficient (R) of 0.443 and weighted average of 6.4%, a difference of 3.9%.
Unemployment Among Ages 30 to 34 years Correlation Summary
| Measurement | Cajun | Hispanic or Latino |
| Minimum | 1.1% | 3.2% |
| Maximum | 49.4% | 14.1% |
| Range | 48.3% | 10.9% |
| Mean | 10.4% | 6.5% |
| Median | 6.7% | 6.1% |
| Interquartile 25% (IQ1) | 5.0% | 5.5% |
| Interquartile 75% (IQ3) | 12.6% | 7.1% |
| Interquartile Range (IQR) | 7.6% | 1.6% |
| Standard Deviation (Sample) | 10.0% | 1.7% |
| Standard Deviation (Population) | 9.9% | 1.7% |
Demographics Similar to Cajuns and Hispanics or Latinos by Unemployment Among Ages 30 to 34 years
In terms of unemployment among ages 30 to 34 years, the demographic groups most similar to Cajuns are Delaware (6.7%, a difference of 0.19%), Belizean (6.6%, a difference of 1.0%), Bahamian (6.6%, a difference of 1.3%), Dutch West Indian (6.6%, a difference of 1.4%), and Immigrants from Barbados (6.6%, a difference of 1.5%). Similarly, the demographic groups most similar to Hispanics or Latinos are Immigrants from Bangladesh (6.4%, a difference of 0.060%), Choctaw (6.4%, a difference of 0.17%), Central American Indian (6.4%, a difference of 0.21%), Immigrants from West Indies (6.4%, a difference of 0.23%), and Senegalese (6.4%, a difference of 0.27%).
| Demographics | Rating | Rank | Unemployment Among Ages 30 to 34 years |
| Hispanics or Latinos | 0.0 /100 | #283 | Tragic 6.4% |
| Immigrants | Bangladesh | 0.0 /100 | #284 | Tragic 6.4% |
| Choctaw | 0.0 /100 | #285 | Tragic 6.4% |
| Central American Indians | 0.0 /100 | #286 | Tragic 6.4% |
| Immigrants | West Indies | 0.0 /100 | #287 | Tragic 6.4% |
| Senegalese | 0.0 /100 | #288 | Tragic 6.4% |
| Menominee | 0.0 /100 | #289 | Tragic 6.4% |
| Immigrants | Trinidad and Tobago | 0.0 /100 | #290 | Tragic 6.5% |
| Jamaicans | 0.0 /100 | #291 | Tragic 6.5% |
| Vietnamese | 0.0 /100 | #292 | Tragic 6.5% |
| West Indians | 0.0 /100 | #293 | Tragic 6.5% |
| Barbadians | 0.0 /100 | #294 | Tragic 6.5% |
| Trinidadians and Tobagonians | 0.0 /100 | #295 | Tragic 6.5% |
| Immigrants | Jamaica | 0.0 /100 | #296 | Tragic 6.5% |
| Creek | 0.0 /100 | #297 | Tragic 6.6% |
| Immigrants | Barbados | 0.0 /100 | #298 | Tragic 6.6% |
| Dutch West Indians | 0.0 /100 | #299 | Tragic 6.6% |
| Bahamians | 0.0 /100 | #300 | Tragic 6.6% |
| Belizeans | 0.0 /100 | #301 | Tragic 6.6% |
| Delaware | 0.0 /100 | #302 | Tragic 6.7% |
| Cajuns | 0.0 /100 | #303 | Tragic 6.7% |