Cajun vs Immigrants from Honduras Doctorate Degree
COMPARE
Cajun
Immigrants from Honduras
Doctorate Degree
Doctorate Degree Comparison
Cajuns
Immigrants from Honduras
1.5%
DOCTORATE DEGREE
0.3/ 100
METRIC RATING
287th/ 347
METRIC RANK
1.4%
DOCTORATE DEGREE
0.1/ 100
METRIC RATING
311th/ 347
METRIC RANK
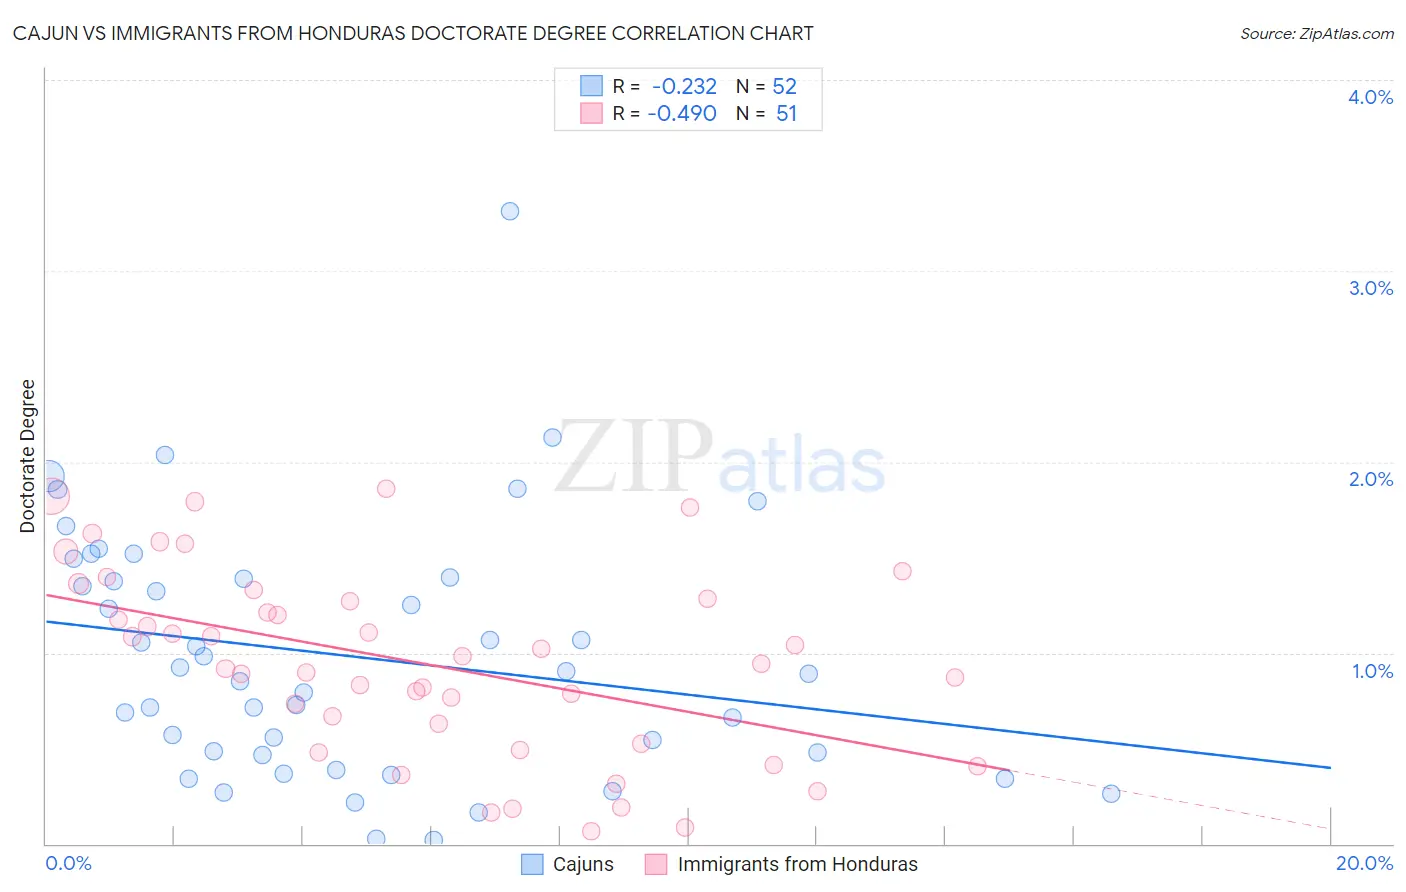
Cajun vs Immigrants from Honduras Doctorate Degree Correlation Chart
The statistical analysis conducted on geographies consisting of 148,318,310 people shows a weak negative correlation between the proportion of Cajuns and percentage of population with at least doctorate degree education in the United States with a correlation coefficient (R) of -0.232 and weighted average of 1.5%. Similarly, the statistical analysis conducted on geographies consisting of 318,827,529 people shows a moderate negative correlation between the proportion of Immigrants from Honduras and percentage of population with at least doctorate degree education in the United States with a correlation coefficient (R) of -0.490 and weighted average of 1.4%, a difference of 6.4%.
Doctorate Degree Correlation Summary
| Measurement | Cajun | Immigrants from Honduras |
| Minimum | 0.021% | 0.068% |
| Maximum | 3.3% | 1.9% |
| Range | 3.3% | 1.8% |
| Mean | 0.98% | 0.95% |
| Median | 0.90% | 0.94% |
| Interquartile 25% (IQ1) | 0.47% | 0.52% |
| Interquartile 75% (IQ3) | 1.4% | 1.3% |
| Interquartile Range (IQR) | 0.92% | 0.76% |
| Standard Deviation (Sample) | 0.65% | 0.49% |
| Standard Deviation (Population) | 0.65% | 0.48% |
Similar Demographics by Doctorate Degree
Demographics Similar to Cajuns by Doctorate Degree
In terms of doctorate degree, the demographic groups most similar to Cajuns are Cherokee (1.5%, a difference of 0.17%), Immigrants from El Salvador (1.4%, a difference of 0.18%), Cape Verdean (1.4%, a difference of 0.31%), Choctaw (1.4%, a difference of 0.33%), and Malaysian (1.5%, a difference of 0.34%).
| Demographics | Rating | Rank | Doctorate Degree |
| Ecuadorians | 0.4 /100 | #280 | Tragic 1.5% |
| Tohono O'odham | 0.4 /100 | #281 | Tragic 1.5% |
| British West Indians | 0.3 /100 | #282 | Tragic 1.5% |
| Central Americans | 0.3 /100 | #283 | Tragic 1.5% |
| Jamaicans | 0.3 /100 | #284 | Tragic 1.5% |
| Malaysians | 0.3 /100 | #285 | Tragic 1.5% |
| Cherokee | 0.3 /100 | #286 | Tragic 1.5% |
| Cajuns | 0.3 /100 | #287 | Tragic 1.5% |
| Immigrants | El Salvador | 0.3 /100 | #288 | Tragic 1.4% |
| Cape Verdeans | 0.3 /100 | #289 | Tragic 1.4% |
| Choctaw | 0.3 /100 | #290 | Tragic 1.4% |
| Blacks/African Americans | 0.3 /100 | #291 | Tragic 1.4% |
| Alaska Natives | 0.3 /100 | #292 | Tragic 1.4% |
| Immigrants | Yemen | 0.2 /100 | #293 | Tragic 1.4% |
| Samoans | 0.2 /100 | #294 | Tragic 1.4% |
Demographics Similar to Immigrants from Honduras by Doctorate Degree
In terms of doctorate degree, the demographic groups most similar to Immigrants from Honduras are Immigrants from Jamaica (1.4%, a difference of 0.18%), Immigrants from Nicaragua (1.4%, a difference of 0.38%), Immigrants from Grenada (1.4%, a difference of 0.47%), Menominee (1.4%, a difference of 0.69%), and Dominican (1.4%, a difference of 0.77%).
| Demographics | Rating | Rank | Doctorate Degree |
| Mexican American Indians | 0.1 /100 | #304 | Tragic 1.4% |
| Pennsylvania Germans | 0.1 /100 | #305 | Tragic 1.4% |
| Guyanese | 0.1 /100 | #306 | Tragic 1.4% |
| Cubans | 0.1 /100 | #307 | Tragic 1.4% |
| Immigrants | Laos | 0.1 /100 | #308 | Tragic 1.4% |
| Immigrants | Grenada | 0.1 /100 | #309 | Tragic 1.4% |
| Immigrants | Jamaica | 0.1 /100 | #310 | Tragic 1.4% |
| Immigrants | Honduras | 0.1 /100 | #311 | Tragic 1.4% |
| Immigrants | Nicaragua | 0.1 /100 | #312 | Tragic 1.4% |
| Menominee | 0.1 /100 | #313 | Tragic 1.4% |
| Dominicans | 0.1 /100 | #314 | Tragic 1.4% |
| Immigrants | Azores | 0.1 /100 | #315 | Tragic 1.4% |
| Navajo | 0.1 /100 | #316 | Tragic 1.4% |
| Immigrants | Micronesia | 0.1 /100 | #317 | Tragic 1.3% |
| Creek | 0.1 /100 | #318 | Tragic 1.3% |