Cajun vs Hispanic or Latino 1st Grade
COMPARE
Cajun
Hispanic or Latino
1st Grade
1st Grade Comparison
Cajuns
Hispanics or Latinos
98.3%
1ST GRADE
99.5/ 100
METRIC RATING
73rd/ 347
METRIC RANK
96.9%
1ST GRADE
0.0/ 100
METRIC RATING
308th/ 347
METRIC RANK
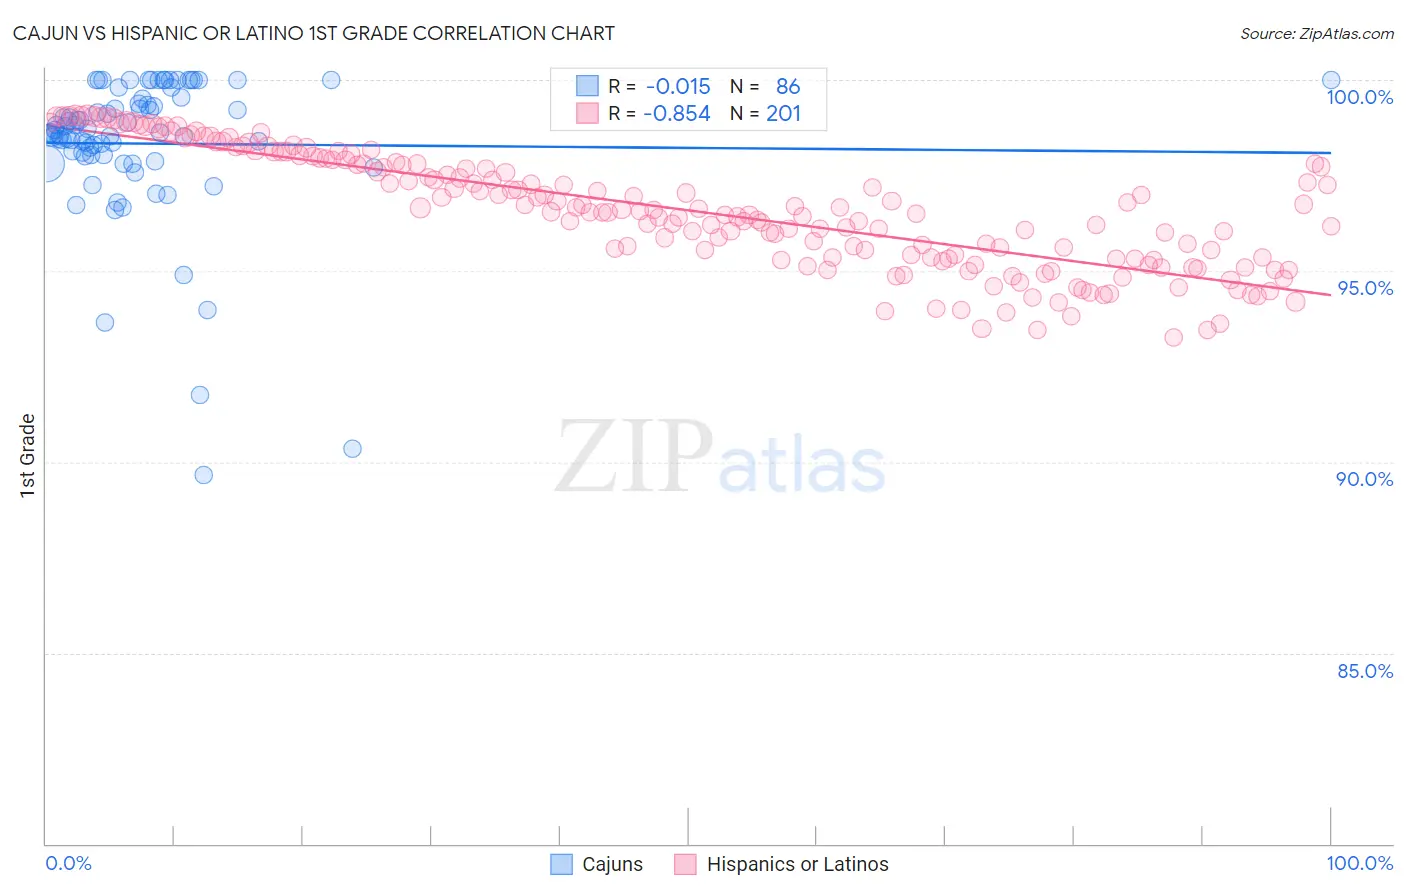
Cajun vs Hispanic or Latino 1st Grade Correlation Chart
The statistical analysis conducted on geographies consisting of 149,712,957 people shows no correlation between the proportion of Cajuns and percentage of population with at least 1st grade education in the United States with a correlation coefficient (R) of -0.015 and weighted average of 98.3%. Similarly, the statistical analysis conducted on geographies consisting of 578,615,396 people shows a very strong negative correlation between the proportion of Hispanics or Latinos and percentage of population with at least 1st grade education in the United States with a correlation coefficient (R) of -0.854 and weighted average of 96.9%, a difference of 1.4%.
1st Grade Correlation Summary
| Measurement | Cajun | Hispanic or Latino |
| Minimum | 89.7% | 93.3% |
| Maximum | 100.0% | 99.1% |
| Range | 10.3% | 5.8% |
| Mean | 98.3% | 96.6% |
| Median | 98.6% | 96.5% |
| Interquartile 25% (IQ1) | 98.0% | 95.3% |
| Interquartile 75% (IQ3) | 99.5% | 97.8% |
| Interquartile Range (IQR) | 1.5% | 2.5% |
| Standard Deviation (Sample) | 1.9% | 1.5% |
| Standard Deviation (Population) | 1.9% | 1.5% |
Similar Demographics by 1st Grade
Demographics Similar to Cajuns by 1st Grade
In terms of 1st grade, the demographic groups most similar to Cajuns are Immigrants from Netherlands (98.3%, a difference of 0.010%), Serbian (98.3%, a difference of 0.020%), Cheyenne (98.3%, a difference of 0.020%), Cherokee (98.3%, a difference of 0.020%), and Shoshone (98.3%, a difference of 0.020%).
| Demographics | Rating | Rank | 1st Grade |
| Canadians | 99.6 /100 | #66 | Exceptional 98.3% |
| Immigrants | Austria | 99.6 /100 | #67 | Exceptional 98.3% |
| Immigrants | Northern Europe | 99.6 /100 | #68 | Exceptional 98.3% |
| Chickasaw | 99.6 /100 | #69 | Exceptional 98.3% |
| Russians | 99.6 /100 | #70 | Exceptional 98.3% |
| Serbians | 99.6 /100 | #71 | Exceptional 98.3% |
| Cheyenne | 99.6 /100 | #72 | Exceptional 98.3% |
| Cajuns | 99.5 /100 | #73 | Exceptional 98.3% |
| Immigrants | Netherlands | 99.4 /100 | #74 | Exceptional 98.3% |
| Cherokee | 99.3 /100 | #75 | Exceptional 98.3% |
| Shoshone | 99.3 /100 | #76 | Exceptional 98.3% |
| Immigrants | England | 99.3 /100 | #77 | Exceptional 98.3% |
| Immigrants | Belgium | 99.2 /100 | #78 | Exceptional 98.3% |
| Immigrants | Lithuania | 99.2 /100 | #79 | Exceptional 98.3% |
| Osage | 99.2 /100 | #80 | Exceptional 98.3% |
Demographics Similar to Hispanics or Latinos by 1st Grade
In terms of 1st grade, the demographic groups most similar to Hispanics or Latinos are Immigrants from Somalia (96.9%, a difference of 0.0%), Immigrants from Haiti (96.9%, a difference of 0.0%), Belizean (96.9%, a difference of 0.010%), Immigrants from the Azores (96.9%, a difference of 0.010%), and Sri Lankan (96.9%, a difference of 0.030%).
| Demographics | Rating | Rank | 1st Grade |
| Immigrants | South Eastern Asia | 0.0 /100 | #301 | Tragic 97.1% |
| Immigrants | Caribbean | 0.0 /100 | #302 | Tragic 97.0% |
| Somalis | 0.0 /100 | #303 | Tragic 97.0% |
| Nicaraguans | 0.0 /100 | #304 | Tragic 97.0% |
| Ecuadorians | 0.0 /100 | #305 | Tragic 97.0% |
| Belizeans | 0.0 /100 | #306 | Tragic 96.9% |
| Immigrants | Somalia | 0.0 /100 | #307 | Tragic 96.9% |
| Hispanics or Latinos | 0.0 /100 | #308 | Tragic 96.9% |
| Immigrants | Haiti | 0.0 /100 | #309 | Tragic 96.9% |
| Immigrants | Azores | 0.0 /100 | #310 | Tragic 96.9% |
| Sri Lankans | 0.0 /100 | #311 | Tragic 96.9% |
| Cape Verdeans | 0.0 /100 | #312 | Tragic 96.9% |
| Guyanese | 0.0 /100 | #313 | Tragic 96.9% |
| Hondurans | 0.0 /100 | #314 | Tragic 96.9% |
| Immigrants | Belize | 0.0 /100 | #315 | Tragic 96.9% |