Liberian vs Puget Sound Salish No Schooling Completed
COMPARE
Liberian
Puget Sound Salish
No Schooling Completed
No Schooling Completed Comparison
Liberians
Puget Sound Salish
2.4%
NO SCHOOLING COMPLETED
1.8/ 100
METRIC RATING
239th/ 347
METRIC RANK
1.8%
NO SCHOOLING COMPLETED
98.5/ 100
METRIC RATING
95th/ 347
METRIC RANK
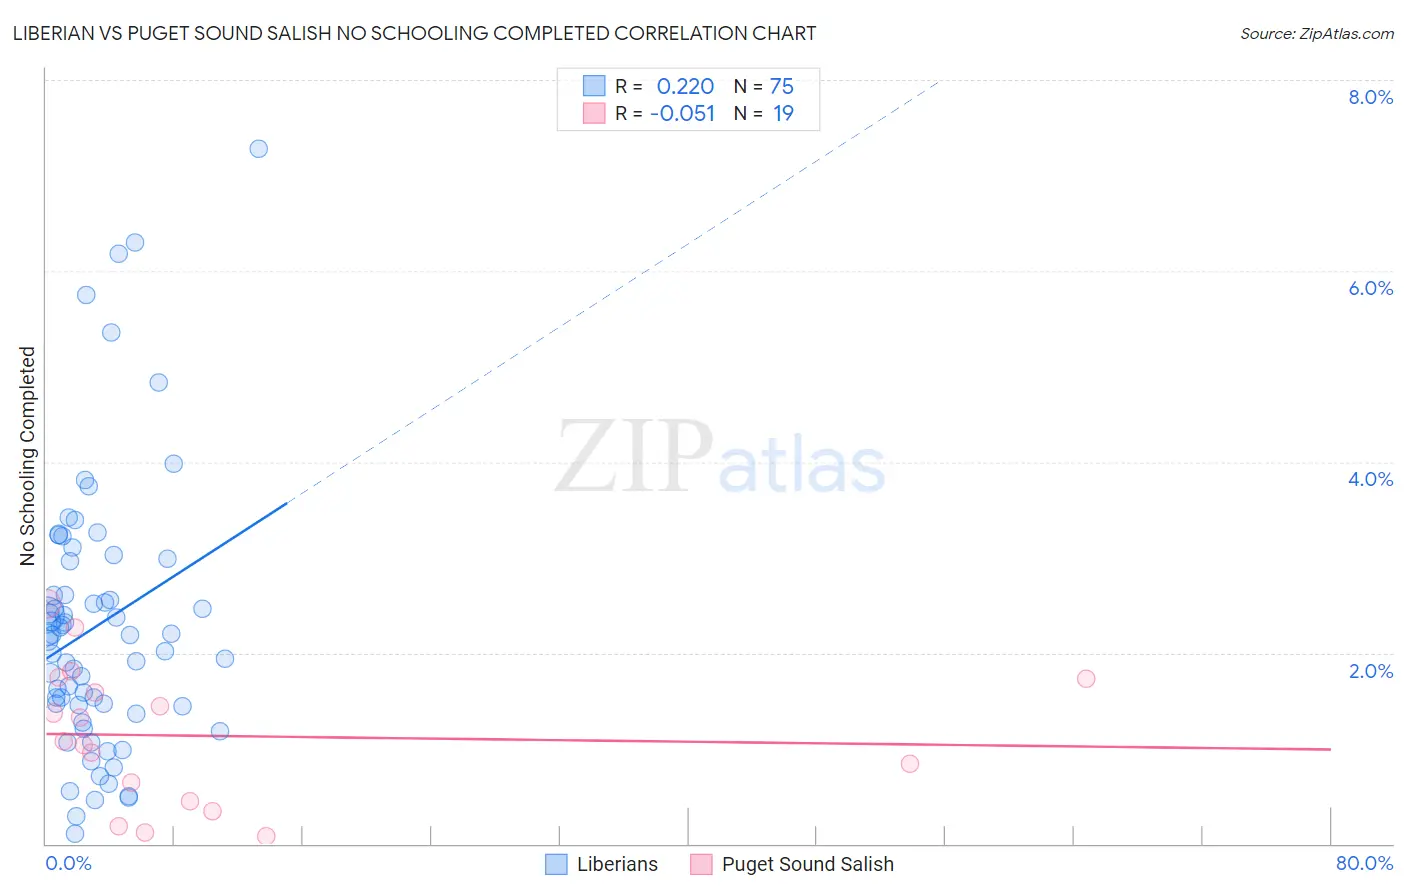
Liberian vs Puget Sound Salish No Schooling Completed Correlation Chart
The statistical analysis conducted on geographies consisting of 117,885,030 people shows a weak positive correlation between the proportion of Liberians and percentage of population with no schooling in the United States with a correlation coefficient (R) of 0.220 and weighted average of 2.4%. Similarly, the statistical analysis conducted on geographies consisting of 45,937,154 people shows a slight negative correlation between the proportion of Puget Sound Salish and percentage of population with no schooling in the United States with a correlation coefficient (R) of -0.051 and weighted average of 1.8%, a difference of 32.0%.
No Schooling Completed Correlation Summary
| Measurement | Liberian | Puget Sound Salish |
| Minimum | 0.10% | 0.082% |
| Maximum | 7.3% | 2.5% |
| Range | 7.2% | 2.4% |
| Mean | 2.3% | 1.1% |
| Median | 2.2% | 1.1% |
| Interquartile 25% (IQ1) | 1.4% | 0.45% |
| Interquartile 75% (IQ3) | 3.0% | 1.7% |
| Interquartile Range (IQR) | 1.5% | 1.3% |
| Standard Deviation (Sample) | 1.4% | 0.72% |
| Standard Deviation (Population) | 1.4% | 0.70% |
Similar Demographics by No Schooling Completed
Demographics Similar to Liberians by No Schooling Completed
In terms of no schooling completed, the demographic groups most similar to Liberians are Paiute (2.4%, a difference of 0.12%), Immigrants from Senegal (2.4%, a difference of 0.23%), Korean (2.4%, a difference of 0.29%), Immigrants from Eastern Asia (2.4%, a difference of 0.33%), and Iraqi (2.4%, a difference of 0.53%).
| Demographics | Rating | Rank | No Schooling Completed |
| Colombians | 3.2 /100 | #232 | Tragic 2.3% |
| Immigrants | Malaysia | 2.8 /100 | #233 | Tragic 2.3% |
| Nigerians | 2.6 /100 | #234 | Tragic 2.3% |
| Immigrants | Western Asia | 2.6 /100 | #235 | Tragic 2.3% |
| Iraqis | 2.2 /100 | #236 | Tragic 2.4% |
| Immigrants | Eastern Asia | 2.0 /100 | #237 | Tragic 2.4% |
| Paiute | 1.9 /100 | #238 | Tragic 2.4% |
| Liberians | 1.8 /100 | #239 | Tragic 2.4% |
| Immigrants | Senegal | 1.7 /100 | #240 | Tragic 2.4% |
| Koreans | 1.7 /100 | #241 | Tragic 2.4% |
| Immigrants | Indonesia | 1.5 /100 | #242 | Tragic 2.4% |
| South Americans | 1.5 /100 | #243 | Tragic 2.4% |
| Peruvians | 1.4 /100 | #244 | Tragic 2.4% |
| Bolivians | 1.4 /100 | #245 | Tragic 2.4% |
| Immigrants | Congo | 1.4 /100 | #246 | Tragic 2.4% |
Demographics Similar to Puget Sound Salish by No Schooling Completed
In terms of no schooling completed, the demographic groups most similar to Puget Sound Salish are Nonimmigrants (1.8%, a difference of 0.010%), Bhutanese (1.8%, a difference of 0.23%), Immigrants from Ireland (1.8%, a difference of 0.41%), Turkish (1.8%, a difference of 0.51%), and Iranian (1.8%, a difference of 0.69%).
| Demographics | Rating | Rank | No Schooling Completed |
| Immigrants | Western Europe | 99.2 /100 | #88 | Exceptional 1.8% |
| South Africans | 99.1 /100 | #89 | Exceptional 1.8% |
| Sioux | 99.0 /100 | #90 | Exceptional 1.8% |
| Immigrants | Germany | 99.0 /100 | #91 | Exceptional 1.8% |
| Romanians | 98.8 /100 | #92 | Exceptional 1.8% |
| Turks | 98.7 /100 | #93 | Exceptional 1.8% |
| Immigrants | Nonimmigrants | 98.5 /100 | #94 | Exceptional 1.8% |
| Puget Sound Salish | 98.5 /100 | #95 | Exceptional 1.8% |
| Bhutanese | 98.4 /100 | #96 | Exceptional 1.8% |
| Immigrants | Ireland | 98.4 /100 | #97 | Exceptional 1.8% |
| Iranians | 98.2 /100 | #98 | Exceptional 1.8% |
| Choctaw | 98.1 /100 | #99 | Exceptional 1.8% |
| Immigrants | Singapore | 98.0 /100 | #100 | Exceptional 1.8% |
| Immigrants | Czechoslovakia | 97.9 /100 | #101 | Exceptional 1.8% |
| Immigrants | Switzerland | 97.9 /100 | #102 | Exceptional 1.8% |