Immigrants from Trinidad and Tobago vs Puget Sound Salish No Schooling Completed
COMPARE
Immigrants from Trinidad and Tobago
Puget Sound Salish
No Schooling Completed
No Schooling Completed Comparison
Immigrants from Trinidad and Tobago
Puget Sound Salish
2.6%
NO SCHOOLING COMPLETED
0.0/ 100
METRIC RATING
283rd/ 347
METRIC RANK
1.8%
NO SCHOOLING COMPLETED
98.5/ 100
METRIC RATING
95th/ 347
METRIC RANK
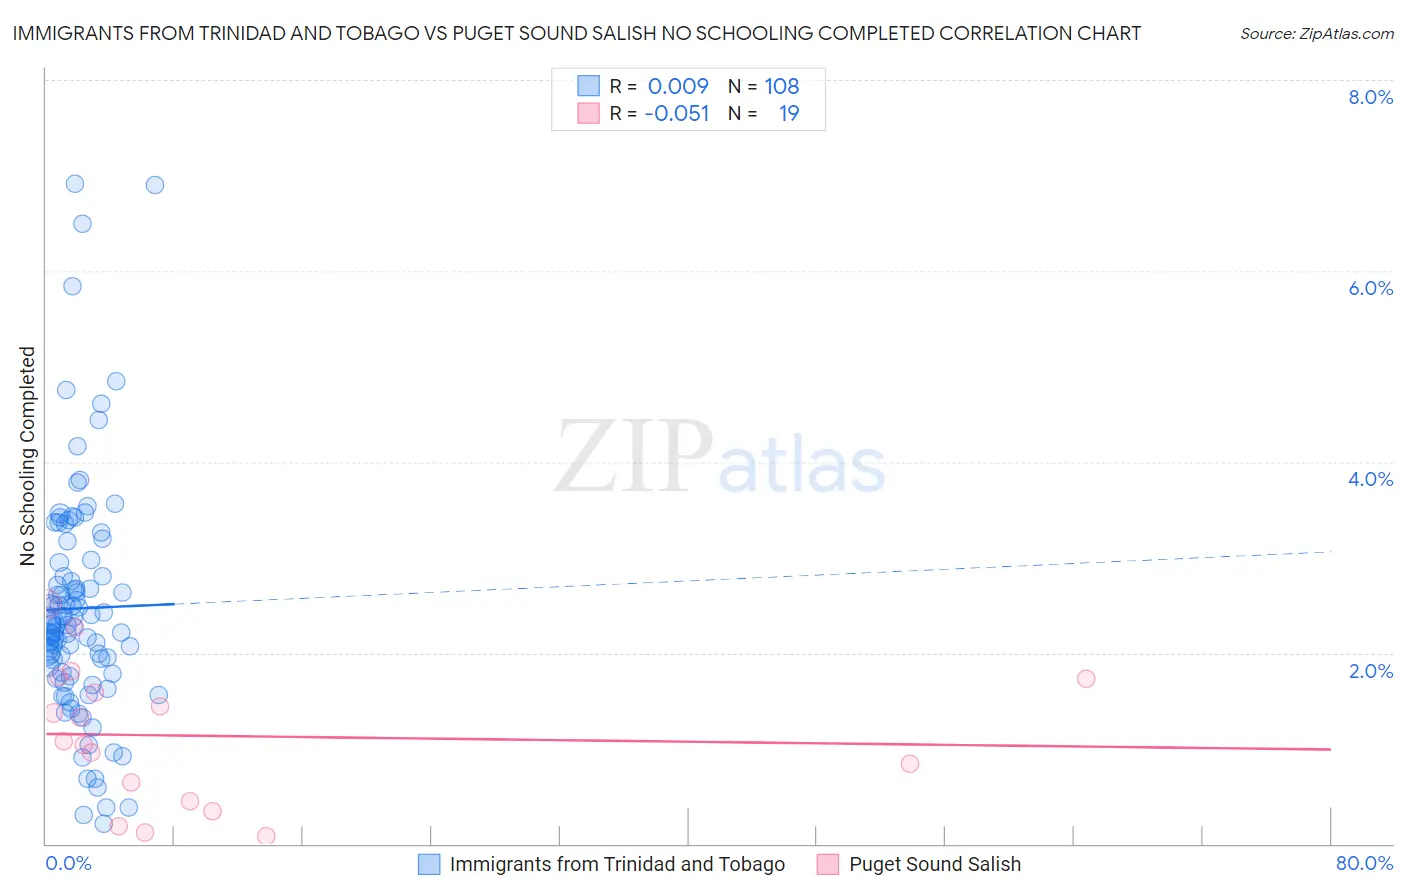
Immigrants from Trinidad and Tobago vs Puget Sound Salish No Schooling Completed Correlation Chart
The statistical analysis conducted on geographies consisting of 222,835,417 people shows no correlation between the proportion of Immigrants from Trinidad and Tobago and percentage of population with no schooling in the United States with a correlation coefficient (R) of 0.009 and weighted average of 2.6%. Similarly, the statistical analysis conducted on geographies consisting of 45,937,154 people shows a slight negative correlation between the proportion of Puget Sound Salish and percentage of population with no schooling in the United States with a correlation coefficient (R) of -0.051 and weighted average of 1.8%, a difference of 46.7%.
No Schooling Completed Correlation Summary
| Measurement | Immigrants from Trinidad and Tobago | Puget Sound Salish |
| Minimum | 0.21% | 0.082% |
| Maximum | 6.9% | 2.5% |
| Range | 6.7% | 2.4% |
| Mean | 2.5% | 1.1% |
| Median | 2.3% | 1.1% |
| Interquartile 25% (IQ1) | 1.8% | 0.45% |
| Interquartile 75% (IQ3) | 2.9% | 1.7% |
| Interquartile Range (IQR) | 1.1% | 1.3% |
| Standard Deviation (Sample) | 1.2% | 0.72% |
| Standard Deviation (Population) | 1.2% | 0.70% |
Similar Demographics by No Schooling Completed
Demographics Similar to Immigrants from Trinidad and Tobago by No Schooling Completed
In terms of no schooling completed, the demographic groups most similar to Immigrants from Trinidad and Tobago are Immigrants from West Indies (2.7%, a difference of 0.72%), Immigrants from Barbados (2.7%, a difference of 0.80%), Immigrants from Ghana (2.6%, a difference of 1.2%), Immigrants from Portugal (2.7%, a difference of 1.2%), and Afghan (2.6%, a difference of 1.4%).
| Demographics | Rating | Rank | No Schooling Completed |
| Immigrants | Western Africa | 0.1 /100 | #276 | Tragic 2.6% |
| Immigrants | Philippines | 0.1 /100 | #277 | Tragic 2.6% |
| Immigrants | Uzbekistan | 0.1 /100 | #278 | Tragic 2.6% |
| Barbadians | 0.1 /100 | #279 | Tragic 2.6% |
| Trinidadians and Tobagonians | 0.1 /100 | #280 | Tragic 2.6% |
| Afghans | 0.1 /100 | #281 | Tragic 2.6% |
| Immigrants | Ghana | 0.1 /100 | #282 | Tragic 2.6% |
| Immigrants | Trinidad and Tobago | 0.0 /100 | #283 | Tragic 2.6% |
| Immigrants | West Indies | 0.0 /100 | #284 | Tragic 2.7% |
| Immigrants | Barbados | 0.0 /100 | #285 | Tragic 2.7% |
| Immigrants | Portugal | 0.0 /100 | #286 | Tragic 2.7% |
| Immigrants | Afghanistan | 0.0 /100 | #287 | Tragic 2.7% |
| Immigrants | St. Vincent and the Grenadines | 0.0 /100 | #288 | Tragic 2.7% |
| Immigrants | Thailand | 0.0 /100 | #289 | Tragic 2.7% |
| Immigrants | Hong Kong | 0.0 /100 | #290 | Tragic 2.7% |
Demographics Similar to Puget Sound Salish by No Schooling Completed
In terms of no schooling completed, the demographic groups most similar to Puget Sound Salish are Nonimmigrants (1.8%, a difference of 0.010%), Bhutanese (1.8%, a difference of 0.23%), Immigrants from Ireland (1.8%, a difference of 0.41%), Turkish (1.8%, a difference of 0.51%), and Iranian (1.8%, a difference of 0.69%).
| Demographics | Rating | Rank | No Schooling Completed |
| Immigrants | Western Europe | 99.2 /100 | #88 | Exceptional 1.8% |
| South Africans | 99.1 /100 | #89 | Exceptional 1.8% |
| Sioux | 99.0 /100 | #90 | Exceptional 1.8% |
| Immigrants | Germany | 99.0 /100 | #91 | Exceptional 1.8% |
| Romanians | 98.8 /100 | #92 | Exceptional 1.8% |
| Turks | 98.7 /100 | #93 | Exceptional 1.8% |
| Immigrants | Nonimmigrants | 98.5 /100 | #94 | Exceptional 1.8% |
| Puget Sound Salish | 98.5 /100 | #95 | Exceptional 1.8% |
| Bhutanese | 98.4 /100 | #96 | Exceptional 1.8% |
| Immigrants | Ireland | 98.4 /100 | #97 | Exceptional 1.8% |
| Iranians | 98.2 /100 | #98 | Exceptional 1.8% |
| Choctaw | 98.1 /100 | #99 | Exceptional 1.8% |
| Immigrants | Singapore | 98.0 /100 | #100 | Exceptional 1.8% |
| Immigrants | Czechoslovakia | 97.9 /100 | #101 | Exceptional 1.8% |
| Immigrants | Switzerland | 97.9 /100 | #102 | Exceptional 1.8% |