Bulgarian vs Immigrants from India 7th Grade
COMPARE
Bulgarian
Immigrants from India
7th Grade
7th Grade Comparison
Bulgarians
Immigrants from India
97.1%
7TH GRADE
99.9/ 100
METRIC RATING
47th/ 347
METRIC RANK
96.9%
7TH GRADE
99.6/ 100
METRIC RATING
68th/ 347
METRIC RANK
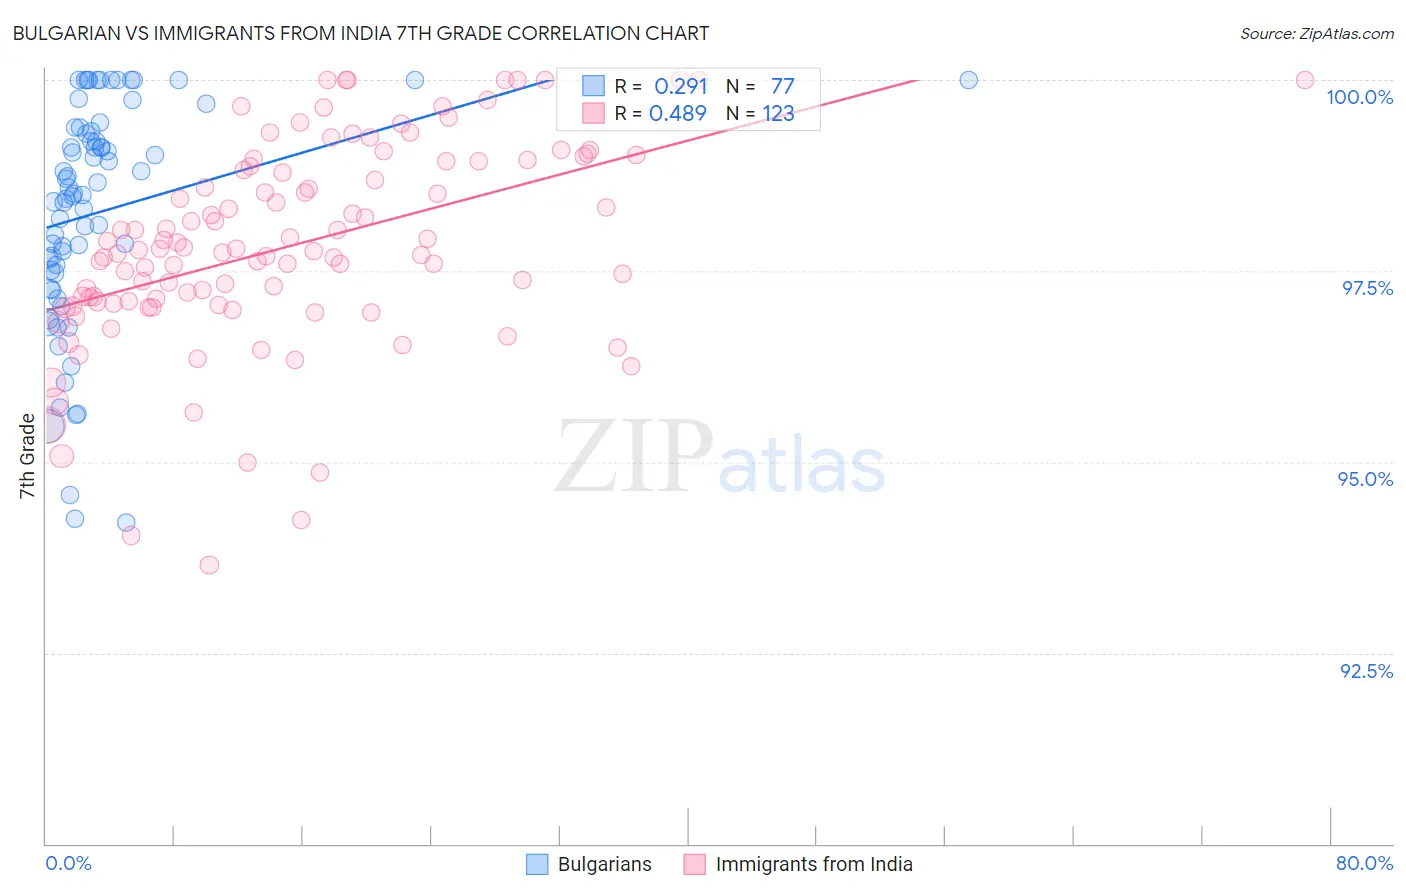
Bulgarian vs Immigrants from India 7th Grade Correlation Chart
The statistical analysis conducted on geographies consisting of 205,632,052 people shows a weak positive correlation between the proportion of Bulgarians and percentage of population with at least 7th grade education in the United States with a correlation coefficient (R) of 0.291 and weighted average of 97.1%. Similarly, the statistical analysis conducted on geographies consisting of 434,105,844 people shows a moderate positive correlation between the proportion of Immigrants from India and percentage of population with at least 7th grade education in the United States with a correlation coefficient (R) of 0.489 and weighted average of 96.9%, a difference of 0.21%.
7th Grade Correlation Summary
| Measurement | Bulgarian | Immigrants from India |
| Minimum | 94.2% | 93.7% |
| Maximum | 100.0% | 100.0% |
| Range | 5.8% | 6.3% |
| Mean | 98.3% | 97.8% |
| Median | 98.5% | 97.8% |
| Interquartile 25% (IQ1) | 97.5% | 97.1% |
| Interquartile 75% (IQ3) | 99.4% | 98.9% |
| Interquartile Range (IQR) | 1.9% | 1.9% |
| Standard Deviation (Sample) | 1.5% | 1.3% |
| Standard Deviation (Population) | 1.5% | 1.3% |
Similar Demographics by 7th Grade
Demographics Similar to Bulgarians by 7th Grade
In terms of 7th grade, the demographic groups most similar to Bulgarians are Celtic (97.1%, a difference of 0.010%), Slavic (97.1%, a difference of 0.010%), Aleut (97.1%, a difference of 0.020%), Immigrants from Scotland (97.1%, a difference of 0.020%), and Northern European (97.1%, a difference of 0.030%).
| Demographics | Rating | Rank | 7th Grade |
| Luxembourgers | 100.0 /100 | #40 | Exceptional 97.2% |
| Eastern Europeans | 100.0 /100 | #41 | Exceptional 97.2% |
| Chinese | 99.9 /100 | #42 | Exceptional 97.1% |
| Maltese | 99.9 /100 | #43 | Exceptional 97.1% |
| Northern Europeans | 99.9 /100 | #44 | Exceptional 97.1% |
| Czechoslovakians | 99.9 /100 | #45 | Exceptional 97.1% |
| Aleuts | 99.9 /100 | #46 | Exceptional 97.1% |
| Bulgarians | 99.9 /100 | #47 | Exceptional 97.1% |
| Celtics | 99.9 /100 | #48 | Exceptional 97.1% |
| Slavs | 99.9 /100 | #49 | Exceptional 97.1% |
| Immigrants | Scotland | 99.9 /100 | #50 | Exceptional 97.1% |
| Estonians | 99.9 /100 | #51 | Exceptional 97.0% |
| Greeks | 99.9 /100 | #52 | Exceptional 97.0% |
| Austrians | 99.8 /100 | #53 | Exceptional 97.0% |
| Australians | 99.8 /100 | #54 | Exceptional 97.0% |
Demographics Similar to Immigrants from India by 7th Grade
In terms of 7th grade, the demographic groups most similar to Immigrants from India are Ukrainian (96.9%, a difference of 0.020%), Native Hawaiian (96.9%, a difference of 0.020%), Iranian (96.8%, a difference of 0.020%), New Zealander (96.8%, a difference of 0.030%), and Immigrants from Lithuania (96.8%, a difference of 0.030%).
| Demographics | Rating | Rank | 7th Grade |
| Creek | 99.8 /100 | #61 | Exceptional 96.9% |
| Immigrants | North America | 99.8 /100 | #62 | Exceptional 96.9% |
| Immigrants | Northern Europe | 99.7 /100 | #63 | Exceptional 96.9% |
| Immigrants | Austria | 99.7 /100 | #64 | Exceptional 96.9% |
| Canadians | 99.7 /100 | #65 | Exceptional 96.9% |
| Ukrainians | 99.7 /100 | #66 | Exceptional 96.9% |
| Native Hawaiians | 99.7 /100 | #67 | Exceptional 96.9% |
| Immigrants | India | 99.6 /100 | #68 | Exceptional 96.9% |
| Iranians | 99.6 /100 | #69 | Exceptional 96.8% |
| New Zealanders | 99.6 /100 | #70 | Exceptional 96.8% |
| Immigrants | Lithuania | 99.6 /100 | #71 | Exceptional 96.8% |
| Cajuns | 99.5 /100 | #72 | Exceptional 96.8% |
| Arapaho | 99.5 /100 | #73 | Exceptional 96.8% |
| Immigrants | England | 99.5 /100 | #74 | Exceptional 96.8% |
| Zimbabweans | 99.5 /100 | #75 | Exceptional 96.8% |