Bulgarian vs Immigrants from Fiji In Labor Force | Age 30-34
COMPARE
Bulgarian
Immigrants from Fiji
In Labor Force | Age 30-34
In Labor Force | Age 30-34 Comparison
Bulgarians
Immigrants from Fiji
86.0%
IN LABOR FORCE | AGE 30-34
100.0/ 100
METRIC RATING
20th/ 347
METRIC RANK
83.4%
IN LABOR FORCE | AGE 30-34
0.0/ 100
METRIC RATING
279th/ 347
METRIC RANK
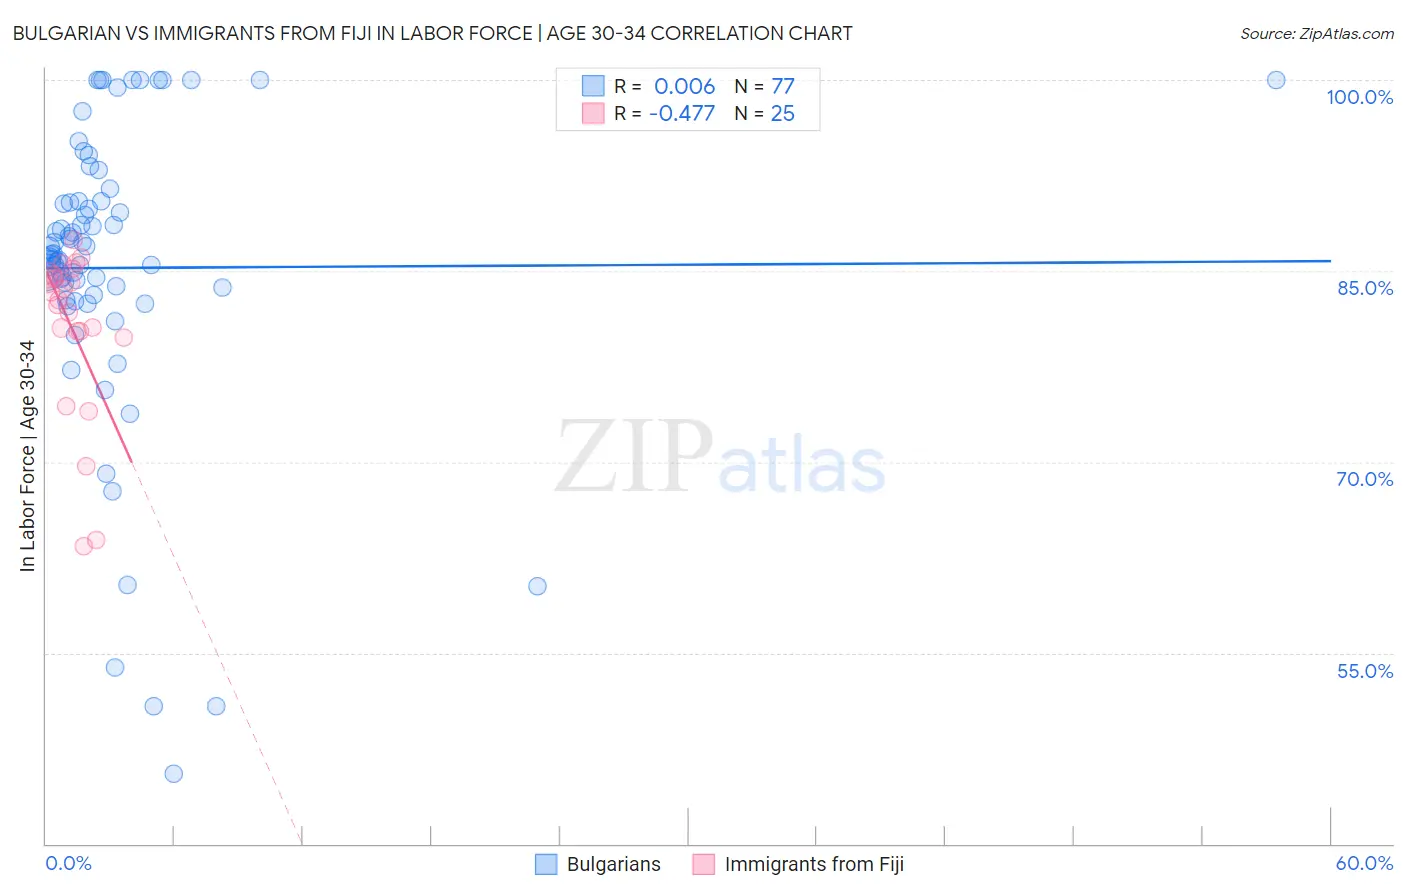
Bulgarian vs Immigrants from Fiji In Labor Force | Age 30-34 Correlation Chart
The statistical analysis conducted on geographies consisting of 205,551,369 people shows no correlation between the proportion of Bulgarians and labor force participation rate among population between the ages 30 and 34 in the United States with a correlation coefficient (R) of 0.006 and weighted average of 86.0%. Similarly, the statistical analysis conducted on geographies consisting of 93,755,407 people shows a moderate negative correlation between the proportion of Immigrants from Fiji and labor force participation rate among population between the ages 30 and 34 in the United States with a correlation coefficient (R) of -0.477 and weighted average of 83.4%, a difference of 3.1%.
In Labor Force | Age 30-34 Correlation Summary
| Measurement | Bulgarian | Immigrants from Fiji |
| Minimum | 45.5% | 63.4% |
| Maximum | 100.0% | 87.5% |
| Range | 54.5% | 24.1% |
| Mean | 85.2% | 80.5% |
| Median | 86.3% | 82.7% |
| Interquartile 25% (IQ1) | 82.9% | 80.0% |
| Interquartile 75% (IQ3) | 90.5% | 84.6% |
| Interquartile Range (IQR) | 7.6% | 4.6% |
| Standard Deviation (Sample) | 11.7% | 6.5% |
| Standard Deviation (Population) | 11.6% | 6.4% |
Similar Demographics by In Labor Force | Age 30-34
Demographics Similar to Bulgarians by In Labor Force | Age 30-34
In terms of in labor force | age 30-34, the demographic groups most similar to Bulgarians are Immigrants from Bulgaria (86.0%, a difference of 0.0%), Sierra Leonean (86.0%, a difference of 0.010%), Bermudan (85.9%, a difference of 0.020%), Estonian (85.9%, a difference of 0.030%), and Immigrants from Eritrea (85.9%, a difference of 0.040%).
| Demographics | Rating | Rank | In Labor Force | Age 30-34 |
| Immigrants | Croatia | 100.0 /100 | #13 | Exceptional 86.1% |
| Immigrants | Cabo Verde | 100.0 /100 | #14 | Exceptional 86.1% |
| Immigrants | Albania | 100.0 /100 | #15 | Exceptional 86.1% |
| Latvians | 100.0 /100 | #16 | Exceptional 86.0% |
| Immigrants | Cameroon | 100.0 /100 | #17 | Exceptional 86.0% |
| Immigrants | Sierra Leone | 100.0 /100 | #18 | Exceptional 86.0% |
| Sierra Leoneans | 100.0 /100 | #19 | Exceptional 86.0% |
| Bulgarians | 100.0 /100 | #20 | Exceptional 86.0% |
| Immigrants | Bulgaria | 100.0 /100 | #21 | Exceptional 86.0% |
| Bermudans | 100.0 /100 | #22 | Exceptional 85.9% |
| Estonians | 100.0 /100 | #23 | Exceptional 85.9% |
| Immigrants | Eritrea | 100.0 /100 | #24 | Exceptional 85.9% |
| Immigrants | North Macedonia | 100.0 /100 | #25 | Exceptional 85.9% |
| Immigrants | Eastern Africa | 100.0 /100 | #26 | Exceptional 85.9% |
| Immigrants | Liberia | 100.0 /100 | #27 | Exceptional 85.9% |
Demographics Similar to Immigrants from Fiji by In Labor Force | Age 30-34
In terms of in labor force | age 30-34, the demographic groups most similar to Immigrants from Fiji are Fijian (83.4%, a difference of 0.010%), African (83.4%, a difference of 0.030%), Delaware (83.5%, a difference of 0.070%), Tongan (83.5%, a difference of 0.080%), and Immigrants from Grenada (83.5%, a difference of 0.090%).
| Demographics | Rating | Rank | In Labor Force | Age 30-34 |
| Immigrants | Nonimmigrants | 0.0 /100 | #272 | Tragic 83.5% |
| Guamanians/Chamorros | 0.0 /100 | #273 | Tragic 83.5% |
| Belizeans | 0.0 /100 | #274 | Tragic 83.5% |
| Immigrants | Grenada | 0.0 /100 | #275 | Tragic 83.5% |
| Tongans | 0.0 /100 | #276 | Tragic 83.5% |
| Delaware | 0.0 /100 | #277 | Tragic 83.5% |
| Fijians | 0.0 /100 | #278 | Tragic 83.4% |
| Immigrants | Fiji | 0.0 /100 | #279 | Tragic 83.4% |
| Africans | 0.0 /100 | #280 | Tragic 83.4% |
| Samoans | 0.0 /100 | #281 | Tragic 83.3% |
| Mexican American Indians | 0.0 /100 | #282 | Tragic 83.2% |
| Assyrians/Chaldeans/Syriacs | 0.0 /100 | #283 | Tragic 83.2% |
| Immigrants | Belize | 0.0 /100 | #284 | Tragic 83.2% |
| Cree | 0.0 /100 | #285 | Tragic 83.2% |
| Immigrants | Latin America | 0.0 /100 | #286 | Tragic 83.1% |