Bulgarian vs Immigrants from Kenya 7th Grade
COMPARE
Bulgarian
Immigrants from Kenya
7th Grade
7th Grade Comparison
Bulgarians
Immigrants from Kenya
97.1%
7TH GRADE
99.9/ 100
METRIC RATING
47th/ 347
METRIC RANK
96.1%
7TH GRADE
66.8/ 100
METRIC RATING
160th/ 347
METRIC RANK
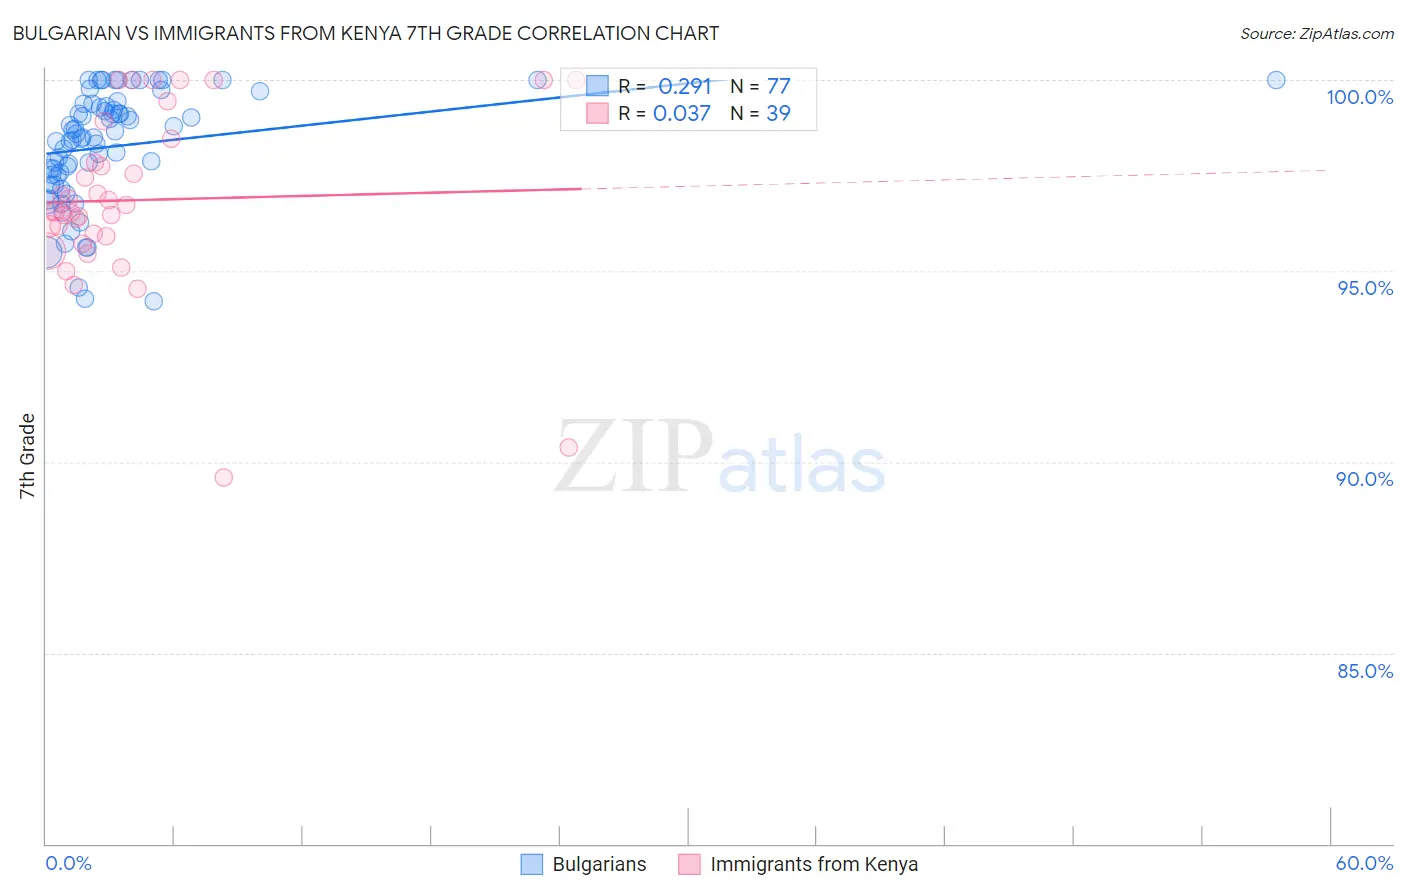
Bulgarian vs Immigrants from Kenya 7th Grade Correlation Chart
The statistical analysis conducted on geographies consisting of 205,632,052 people shows a weak positive correlation between the proportion of Bulgarians and percentage of population with at least 7th grade education in the United States with a correlation coefficient (R) of 0.291 and weighted average of 97.1%. Similarly, the statistical analysis conducted on geographies consisting of 218,076,690 people shows no correlation between the proportion of Immigrants from Kenya and percentage of population with at least 7th grade education in the United States with a correlation coefficient (R) of 0.037 and weighted average of 96.1%, a difference of 0.97%.
7th Grade Correlation Summary
| Measurement | Bulgarian | Immigrants from Kenya |
| Minimum | 94.2% | 89.6% |
| Maximum | 100.0% | 100.0% |
| Range | 5.8% | 10.4% |
| Mean | 98.3% | 96.9% |
| Median | 98.5% | 96.6% |
| Interquartile 25% (IQ1) | 97.5% | 95.9% |
| Interquartile 75% (IQ3) | 99.4% | 98.5% |
| Interquartile Range (IQR) | 1.9% | 2.6% |
| Standard Deviation (Sample) | 1.5% | 2.3% |
| Standard Deviation (Population) | 1.5% | 2.3% |
Similar Demographics by 7th Grade
Demographics Similar to Bulgarians by 7th Grade
In terms of 7th grade, the demographic groups most similar to Bulgarians are Celtic (97.1%, a difference of 0.010%), Slavic (97.1%, a difference of 0.010%), Aleut (97.1%, a difference of 0.020%), Immigrants from Scotland (97.1%, a difference of 0.020%), and Northern European (97.1%, a difference of 0.030%).
| Demographics | Rating | Rank | 7th Grade |
| Luxembourgers | 100.0 /100 | #40 | Exceptional 97.2% |
| Eastern Europeans | 100.0 /100 | #41 | Exceptional 97.2% |
| Chinese | 99.9 /100 | #42 | Exceptional 97.1% |
| Maltese | 99.9 /100 | #43 | Exceptional 97.1% |
| Northern Europeans | 99.9 /100 | #44 | Exceptional 97.1% |
| Czechoslovakians | 99.9 /100 | #45 | Exceptional 97.1% |
| Aleuts | 99.9 /100 | #46 | Exceptional 97.1% |
| Bulgarians | 99.9 /100 | #47 | Exceptional 97.1% |
| Celtics | 99.9 /100 | #48 | Exceptional 97.1% |
| Slavs | 99.9 /100 | #49 | Exceptional 97.1% |
| Immigrants | Scotland | 99.9 /100 | #50 | Exceptional 97.1% |
| Estonians | 99.9 /100 | #51 | Exceptional 97.0% |
| Greeks | 99.9 /100 | #52 | Exceptional 97.0% |
| Austrians | 99.8 /100 | #53 | Exceptional 97.0% |
| Australians | 99.8 /100 | #54 | Exceptional 97.0% |
Demographics Similar to Immigrants from Kenya by 7th Grade
In terms of 7th grade, the demographic groups most similar to Immigrants from Kenya are Alsatian (96.1%, a difference of 0.0%), Bermudan (96.1%, a difference of 0.0%), Arab (96.2%, a difference of 0.010%), Pima (96.1%, a difference of 0.020%), and Spaniard (96.1%, a difference of 0.030%).
| Demographics | Rating | Rank | 7th Grade |
| Seminole | 78.1 /100 | #153 | Good 96.2% |
| Immigrants | Israel | 77.6 /100 | #154 | Good 96.2% |
| Immigrants | Jordan | 77.0 /100 | #155 | Good 96.2% |
| Kenyans | 76.2 /100 | #156 | Good 96.2% |
| Ugandans | 75.5 /100 | #157 | Good 96.2% |
| Arabs | 68.6 /100 | #158 | Good 96.2% |
| Alsatians | 67.2 /100 | #159 | Good 96.1% |
| Immigrants | Kenya | 66.8 /100 | #160 | Good 96.1% |
| Bermudans | 66.3 /100 | #161 | Good 96.1% |
| Pima | 64.3 /100 | #162 | Good 96.1% |
| Spaniards | 62.6 /100 | #163 | Good 96.1% |
| Immigrants | Italy | 62.1 /100 | #164 | Good 96.1% |
| Immigrants | Taiwan | 61.5 /100 | #165 | Good 96.1% |
| Immigrants | Kazakhstan | 61.0 /100 | #166 | Good 96.1% |
| Immigrants | Sri Lanka | 59.9 /100 | #167 | Average 96.1% |