British vs Immigrants from Germany College, Under 1 year
COMPARE
British
Immigrants from Germany
College, Under 1 year
College, Under 1 year Comparison
British
Immigrants from Germany
68.5%
COLLEGE, UNDER 1 YEAR
98.6/ 100
METRIC RATING
77th/ 347
METRIC RANK
66.5%
COLLEGE, UNDER 1 YEAR
82.0/ 100
METRIC RATING
144th/ 347
METRIC RANK
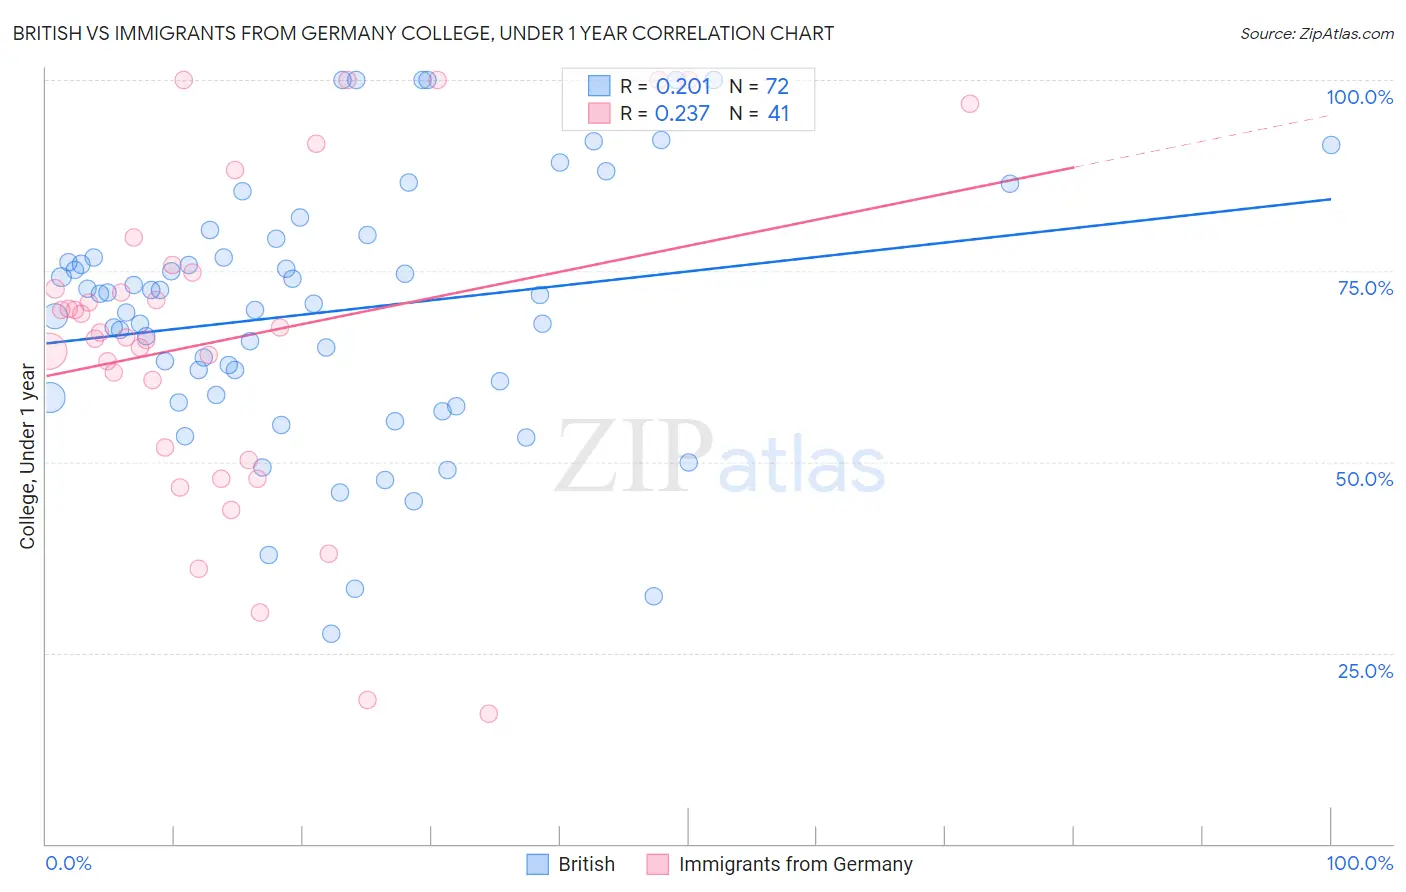
British vs Immigrants from Germany College, Under 1 year Correlation Chart
The statistical analysis conducted on geographies consisting of 531,460,716 people shows a weak positive correlation between the proportion of British and percentage of population with at least college, under 1 year education in the United States with a correlation coefficient (R) of 0.201 and weighted average of 68.5%. Similarly, the statistical analysis conducted on geographies consisting of 463,885,143 people shows a weak positive correlation between the proportion of Immigrants from Germany and percentage of population with at least college, under 1 year education in the United States with a correlation coefficient (R) of 0.237 and weighted average of 66.5%, a difference of 3.0%.
College, Under 1 year Correlation Summary
| Measurement | British | Immigrants from Germany |
| Minimum | 27.5% | 17.0% |
| Maximum | 100.0% | 100.0% |
| Range | 72.5% | 83.0% |
| Mean | 69.6% | 66.2% |
| Median | 71.2% | 66.9% |
| Interquartile 25% (IQ1) | 58.6% | 51.1% |
| Interquartile 75% (IQ3) | 77.9% | 75.3% |
| Interquartile Range (IQR) | 19.3% | 24.2% |
| Standard Deviation (Sample) | 16.7% | 21.2% |
| Standard Deviation (Population) | 16.6% | 21.0% |
Similar Demographics by College, Under 1 year
Demographics Similar to British by College, Under 1 year
In terms of college, under 1 year, the demographic groups most similar to British are Danish (68.5%, a difference of 0.010%), Greek (68.5%, a difference of 0.020%), Immigrants from Western Europe (68.5%, a difference of 0.040%), Laotian (68.5%, a difference of 0.040%), and Immigrants from Spain (68.4%, a difference of 0.050%).
| Demographics | Rating | Rank | College, Under 1 year |
| Lithuanians | 99.1 /100 | #70 | Exceptional 68.8% |
| Immigrants | Europe | 99.1 /100 | #71 | Exceptional 68.8% |
| Bolivians | 99.0 /100 | #72 | Exceptional 68.7% |
| Immigrants | England | 99.0 /100 | #73 | Exceptional 68.7% |
| Swedes | 98.9 /100 | #74 | Exceptional 68.7% |
| Immigrants | Western Europe | 98.6 /100 | #75 | Exceptional 68.5% |
| Laotians | 98.6 /100 | #76 | Exceptional 68.5% |
| British | 98.6 /100 | #77 | Exceptional 68.5% |
| Danes | 98.6 /100 | #78 | Exceptional 68.5% |
| Greeks | 98.6 /100 | #79 | Exceptional 68.5% |
| Immigrants | Spain | 98.5 /100 | #80 | Exceptional 68.4% |
| Immigrants | Greece | 98.5 /100 | #81 | Exceptional 68.4% |
| Norwegians | 98.4 /100 | #82 | Exceptional 68.4% |
| Argentineans | 98.4 /100 | #83 | Exceptional 68.4% |
| Immigrants | Hungary | 98.3 /100 | #84 | Exceptional 68.3% |
Demographics Similar to Immigrants from Germany by College, Under 1 year
In terms of college, under 1 year, the demographic groups most similar to Immigrants from Germany are Immigrants from Kenya (66.5%, a difference of 0.010%), Kenyan (66.5%, a difference of 0.020%), Immigrants from Morocco (66.5%, a difference of 0.020%), Immigrants from Uganda (66.5%, a difference of 0.060%), and English (66.6%, a difference of 0.070%).
| Demographics | Rating | Rank | College, Under 1 year |
| Immigrants | Chile | 87.4 /100 | #137 | Excellent 66.8% |
| Immigrants | Italy | 86.9 /100 | #138 | Excellent 66.8% |
| Venezuelans | 85.9 /100 | #139 | Excellent 66.7% |
| Slavs | 85.9 /100 | #140 | Excellent 66.7% |
| Immigrants | Afghanistan | 85.1 /100 | #141 | Excellent 66.7% |
| English | 82.9 /100 | #142 | Excellent 66.6% |
| Immigrants | Uganda | 82.8 /100 | #143 | Excellent 66.5% |
| Immigrants | Germany | 82.0 /100 | #144 | Excellent 66.5% |
| Immigrants | Kenya | 81.8 /100 | #145 | Excellent 66.5% |
| Kenyans | 81.7 /100 | #146 | Excellent 66.5% |
| Immigrants | Morocco | 81.7 /100 | #147 | Excellent 66.5% |
| Taiwanese | 78.6 /100 | #148 | Good 66.4% |
| Immigrants | Venezuela | 77.9 /100 | #149 | Good 66.3% |
| Immigrants | Iraq | 77.1 /100 | #150 | Good 66.3% |
| Immigrants | Sudan | 76.0 /100 | #151 | Good 66.2% |