British vs Immigrants from Congo College, Under 1 year
COMPARE
British
Immigrants from Congo
College, Under 1 year
College, Under 1 year Comparison
British
Immigrants from Congo
68.5%
COLLEGE, UNDER 1 YEAR
98.6/ 100
METRIC RATING
77th/ 347
METRIC RANK
61.7%
COLLEGE, UNDER 1 YEAR
0.5/ 100
METRIC RATING
250th/ 347
METRIC RANK
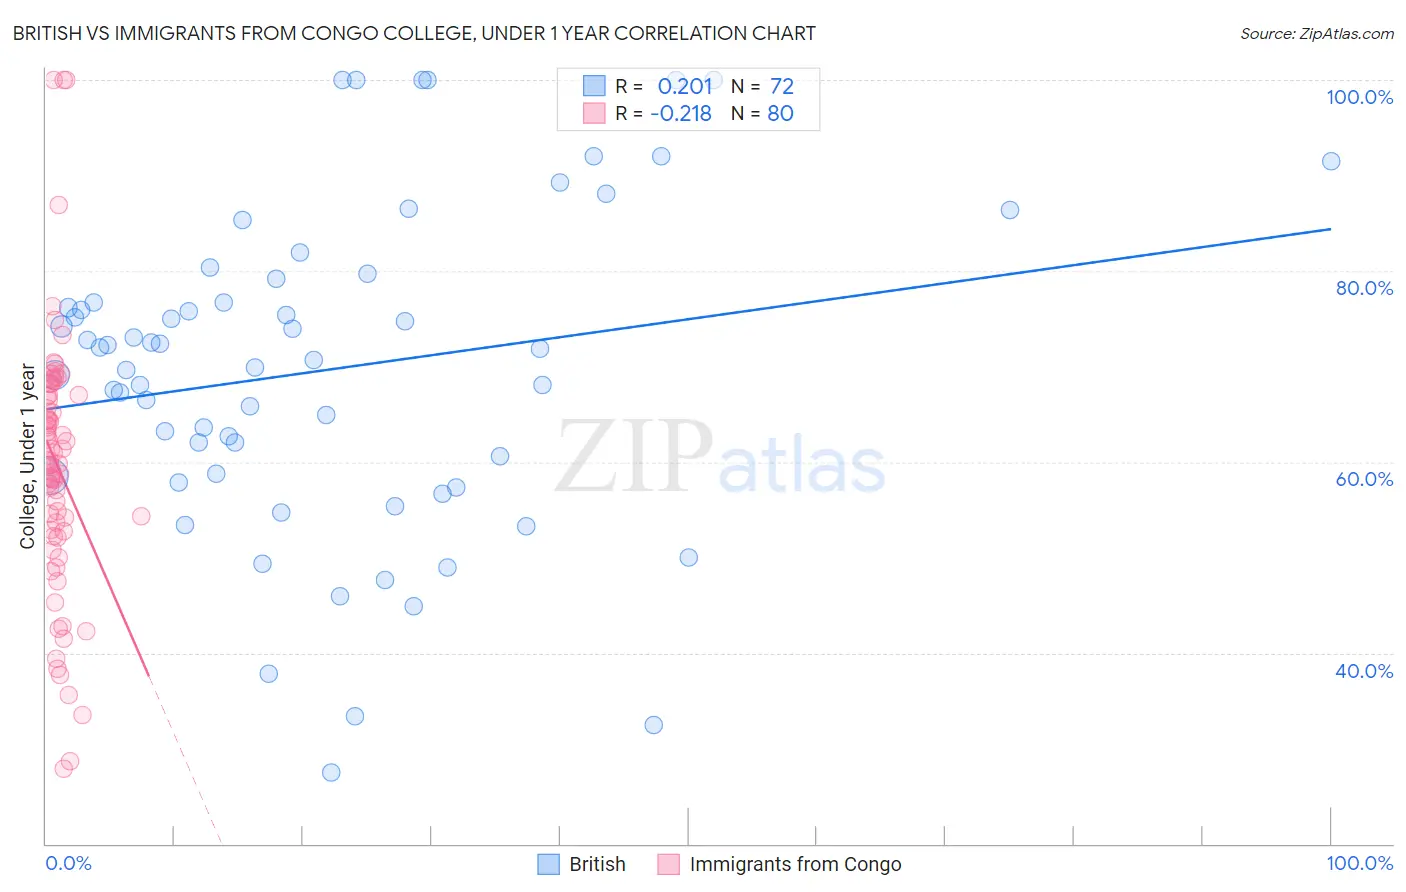
British vs Immigrants from Congo College, Under 1 year Correlation Chart
The statistical analysis conducted on geographies consisting of 531,460,716 people shows a weak positive correlation between the proportion of British and percentage of population with at least college, under 1 year education in the United States with a correlation coefficient (R) of 0.201 and weighted average of 68.5%. Similarly, the statistical analysis conducted on geographies consisting of 92,134,997 people shows a weak negative correlation between the proportion of Immigrants from Congo and percentage of population with at least college, under 1 year education in the United States with a correlation coefficient (R) of -0.218 and weighted average of 61.7%, a difference of 11.1%.
College, Under 1 year Correlation Summary
| Measurement | British | Immigrants from Congo |
| Minimum | 27.5% | 27.9% |
| Maximum | 100.0% | 100.0% |
| Range | 72.5% | 72.1% |
| Mean | 69.6% | 59.7% |
| Median | 71.2% | 60.2% |
| Interquartile 25% (IQ1) | 58.6% | 52.8% |
| Interquartile 75% (IQ3) | 77.9% | 67.0% |
| Interquartile Range (IQR) | 19.3% | 14.2% |
| Standard Deviation (Sample) | 16.7% | 13.7% |
| Standard Deviation (Population) | 16.6% | 13.6% |
Similar Demographics by College, Under 1 year
Demographics Similar to British by College, Under 1 year
In terms of college, under 1 year, the demographic groups most similar to British are Danish (68.5%, a difference of 0.010%), Greek (68.5%, a difference of 0.020%), Immigrants from Western Europe (68.5%, a difference of 0.040%), Laotian (68.5%, a difference of 0.040%), and Immigrants from Spain (68.4%, a difference of 0.050%).
| Demographics | Rating | Rank | College, Under 1 year |
| Lithuanians | 99.1 /100 | #70 | Exceptional 68.8% |
| Immigrants | Europe | 99.1 /100 | #71 | Exceptional 68.8% |
| Bolivians | 99.0 /100 | #72 | Exceptional 68.7% |
| Immigrants | England | 99.0 /100 | #73 | Exceptional 68.7% |
| Swedes | 98.9 /100 | #74 | Exceptional 68.7% |
| Immigrants | Western Europe | 98.6 /100 | #75 | Exceptional 68.5% |
| Laotians | 98.6 /100 | #76 | Exceptional 68.5% |
| British | 98.6 /100 | #77 | Exceptional 68.5% |
| Danes | 98.6 /100 | #78 | Exceptional 68.5% |
| Greeks | 98.6 /100 | #79 | Exceptional 68.5% |
| Immigrants | Spain | 98.5 /100 | #80 | Exceptional 68.4% |
| Immigrants | Greece | 98.5 /100 | #81 | Exceptional 68.4% |
| Norwegians | 98.4 /100 | #82 | Exceptional 68.4% |
| Argentineans | 98.4 /100 | #83 | Exceptional 68.4% |
| Immigrants | Hungary | 98.3 /100 | #84 | Exceptional 68.3% |
Demographics Similar to Immigrants from Congo by College, Under 1 year
In terms of college, under 1 year, the demographic groups most similar to Immigrants from Congo are Vietnamese (61.7%, a difference of 0.0%), Potawatomi (61.8%, a difference of 0.16%), Immigrants from Micronesia (61.5%, a difference of 0.19%), West Indian (61.5%, a difference of 0.30%), and Japanese (61.5%, a difference of 0.30%).
| Demographics | Rating | Rank | College, Under 1 year |
| Hawaiians | 1.1 /100 | #243 | Tragic 62.1% |
| Colville | 1.0 /100 | #244 | Tragic 62.1% |
| Delaware | 0.9 /100 | #245 | Tragic 62.1% |
| Marshallese | 0.8 /100 | #246 | Tragic 61.9% |
| Immigrants | Liberia | 0.8 /100 | #247 | Tragic 61.9% |
| Potawatomi | 0.6 /100 | #248 | Tragic 61.8% |
| Vietnamese | 0.5 /100 | #249 | Tragic 61.7% |
| Immigrants | Congo | 0.5 /100 | #250 | Tragic 61.7% |
| Immigrants | Micronesia | 0.5 /100 | #251 | Tragic 61.5% |
| West Indians | 0.4 /100 | #252 | Tragic 61.5% |
| Japanese | 0.4 /100 | #253 | Tragic 61.5% |
| Immigrants | Cambodia | 0.4 /100 | #254 | Tragic 61.5% |
| Comanche | 0.4 /100 | #255 | Tragic 61.4% |
| Bangladeshis | 0.4 /100 | #256 | Tragic 61.4% |
| Immigrants | Laos | 0.3 /100 | #257 | Tragic 61.3% |