British vs Ukrainian Master's Degree
COMPARE
British
Ukrainian
Master's Degree
Master's Degree Comparison
British
Ukrainians
16.4%
MASTER'S DEGREE
95.6/ 100
METRIC RATING
122nd/ 347
METRIC RANK
16.9%
MASTER'S DEGREE
98.3/ 100
METRIC RATING
104th/ 347
METRIC RANK
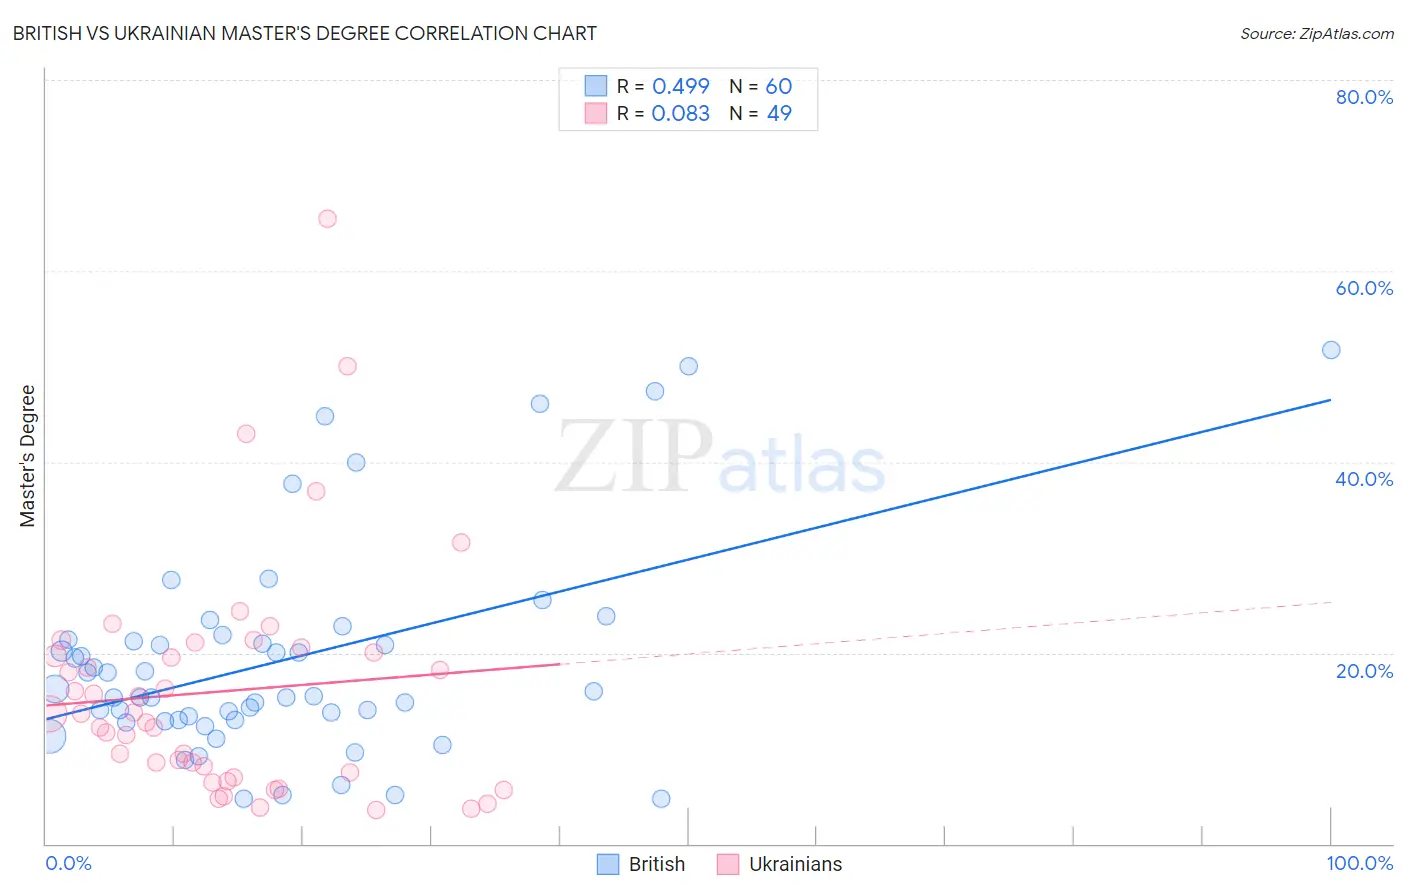
British vs Ukrainian Master's Degree Correlation Chart
The statistical analysis conducted on geographies consisting of 531,094,529 people shows a moderate positive correlation between the proportion of British and percentage of population with at least master's degree education in the United States with a correlation coefficient (R) of 0.499 and weighted average of 16.4%. Similarly, the statistical analysis conducted on geographies consisting of 448,518,691 people shows a slight positive correlation between the proportion of Ukrainians and percentage of population with at least master's degree education in the United States with a correlation coefficient (R) of 0.083 and weighted average of 16.9%, a difference of 2.9%.
Master's Degree Correlation Summary
| Measurement | British | Ukrainian |
| Minimum | 4.8% | 3.6% |
| Maximum | 51.7% | 65.5% |
| Range | 47.0% | 61.9% |
| Mean | 19.2% | 16.0% |
| Median | 15.7% | 13.6% |
| Interquartile 25% (IQ1) | 13.0% | 7.2% |
| Interquartile 75% (IQ3) | 21.3% | 20.3% |
| Interquartile Range (IQR) | 8.4% | 13.1% |
| Standard Deviation (Sample) | 11.1% | 12.3% |
| Standard Deviation (Population) | 11.0% | 12.2% |
Demographics Similar to British and Ukrainians by Master's Degree
In terms of master's degree, the demographic groups most similar to British are Croatian (16.4%, a difference of 0.010%), Afghan (16.5%, a difference of 0.43%), Lebanese (16.5%, a difference of 0.63%), Jordanian (16.5%, a difference of 0.73%), and Brazilian (16.5%, a difference of 0.96%). Similarly, the demographic groups most similar to Ukrainians are Syrian (16.8%, a difference of 0.10%), Alsatian (16.9%, a difference of 0.12%), Immigrants from Albania (16.8%, a difference of 0.38%), Armenian (16.8%, a difference of 0.47%), and Sierra Leonean (16.8%, a difference of 0.50%).
| Demographics | Rating | Rank | Master's Degree |
| Alsatians | 98.4 /100 | #103 | Exceptional 16.9% |
| Ukrainians | 98.3 /100 | #104 | Exceptional 16.9% |
| Syrians | 98.3 /100 | #105 | Exceptional 16.8% |
| Immigrants | Albania | 98.1 /100 | #106 | Exceptional 16.8% |
| Armenians | 98.0 /100 | #107 | Exceptional 16.8% |
| Sierra Leoneans | 98.0 /100 | #108 | Exceptional 16.8% |
| Moroccans | 98.0 /100 | #109 | Exceptional 16.8% |
| Immigrants | Chile | 98.0 /100 | #110 | Exceptional 16.8% |
| Austrians | 97.8 /100 | #111 | Exceptional 16.7% |
| Macedonians | 97.7 /100 | #112 | Exceptional 16.7% |
| Arabs | 97.7 /100 | #113 | Exceptional 16.7% |
| Northern Europeans | 97.6 /100 | #114 | Exceptional 16.7% |
| Immigrants | Uganda | 97.3 /100 | #115 | Exceptional 16.6% |
| Immigrants | Southern Europe | 97.2 /100 | #116 | Exceptional 16.6% |
| Immigrants | Moldova | 97.2 /100 | #117 | Exceptional 16.6% |
| Brazilians | 96.8 /100 | #118 | Exceptional 16.5% |
| Jordanians | 96.5 /100 | #119 | Exceptional 16.5% |
| Lebanese | 96.4 /100 | #120 | Exceptional 16.5% |
| Afghans | 96.2 /100 | #121 | Exceptional 16.5% |
| British | 95.6 /100 | #122 | Exceptional 16.4% |
| Croatians | 95.6 /100 | #123 | Exceptional 16.4% |